|
FINAL PROJECT: VALENCIA COUNTY AGRICULTURE |
|||||||||
|
INTRODUCTION | The
Middle Rio Grande Valley in New Mexico has a long, rich history of
agriculture, a unique layout of smaller plots of farms and hobby gardens over
large swaths of commodity crops found in other areas in the US and deals
regularly with drought in an arid desert climate (see figure 1 for land cover
and notice the vibrant cultivated valley). The Valley consists of four
counties in the northwest central section of New Mexico; Sandoval,
Bernalillo, Valencia, and Socorro counties. The focus of this study is on
agriculture in the Middle Rio Grande Valley, specifically looking at Valencia
County.
Figure 1: Valencia County Land
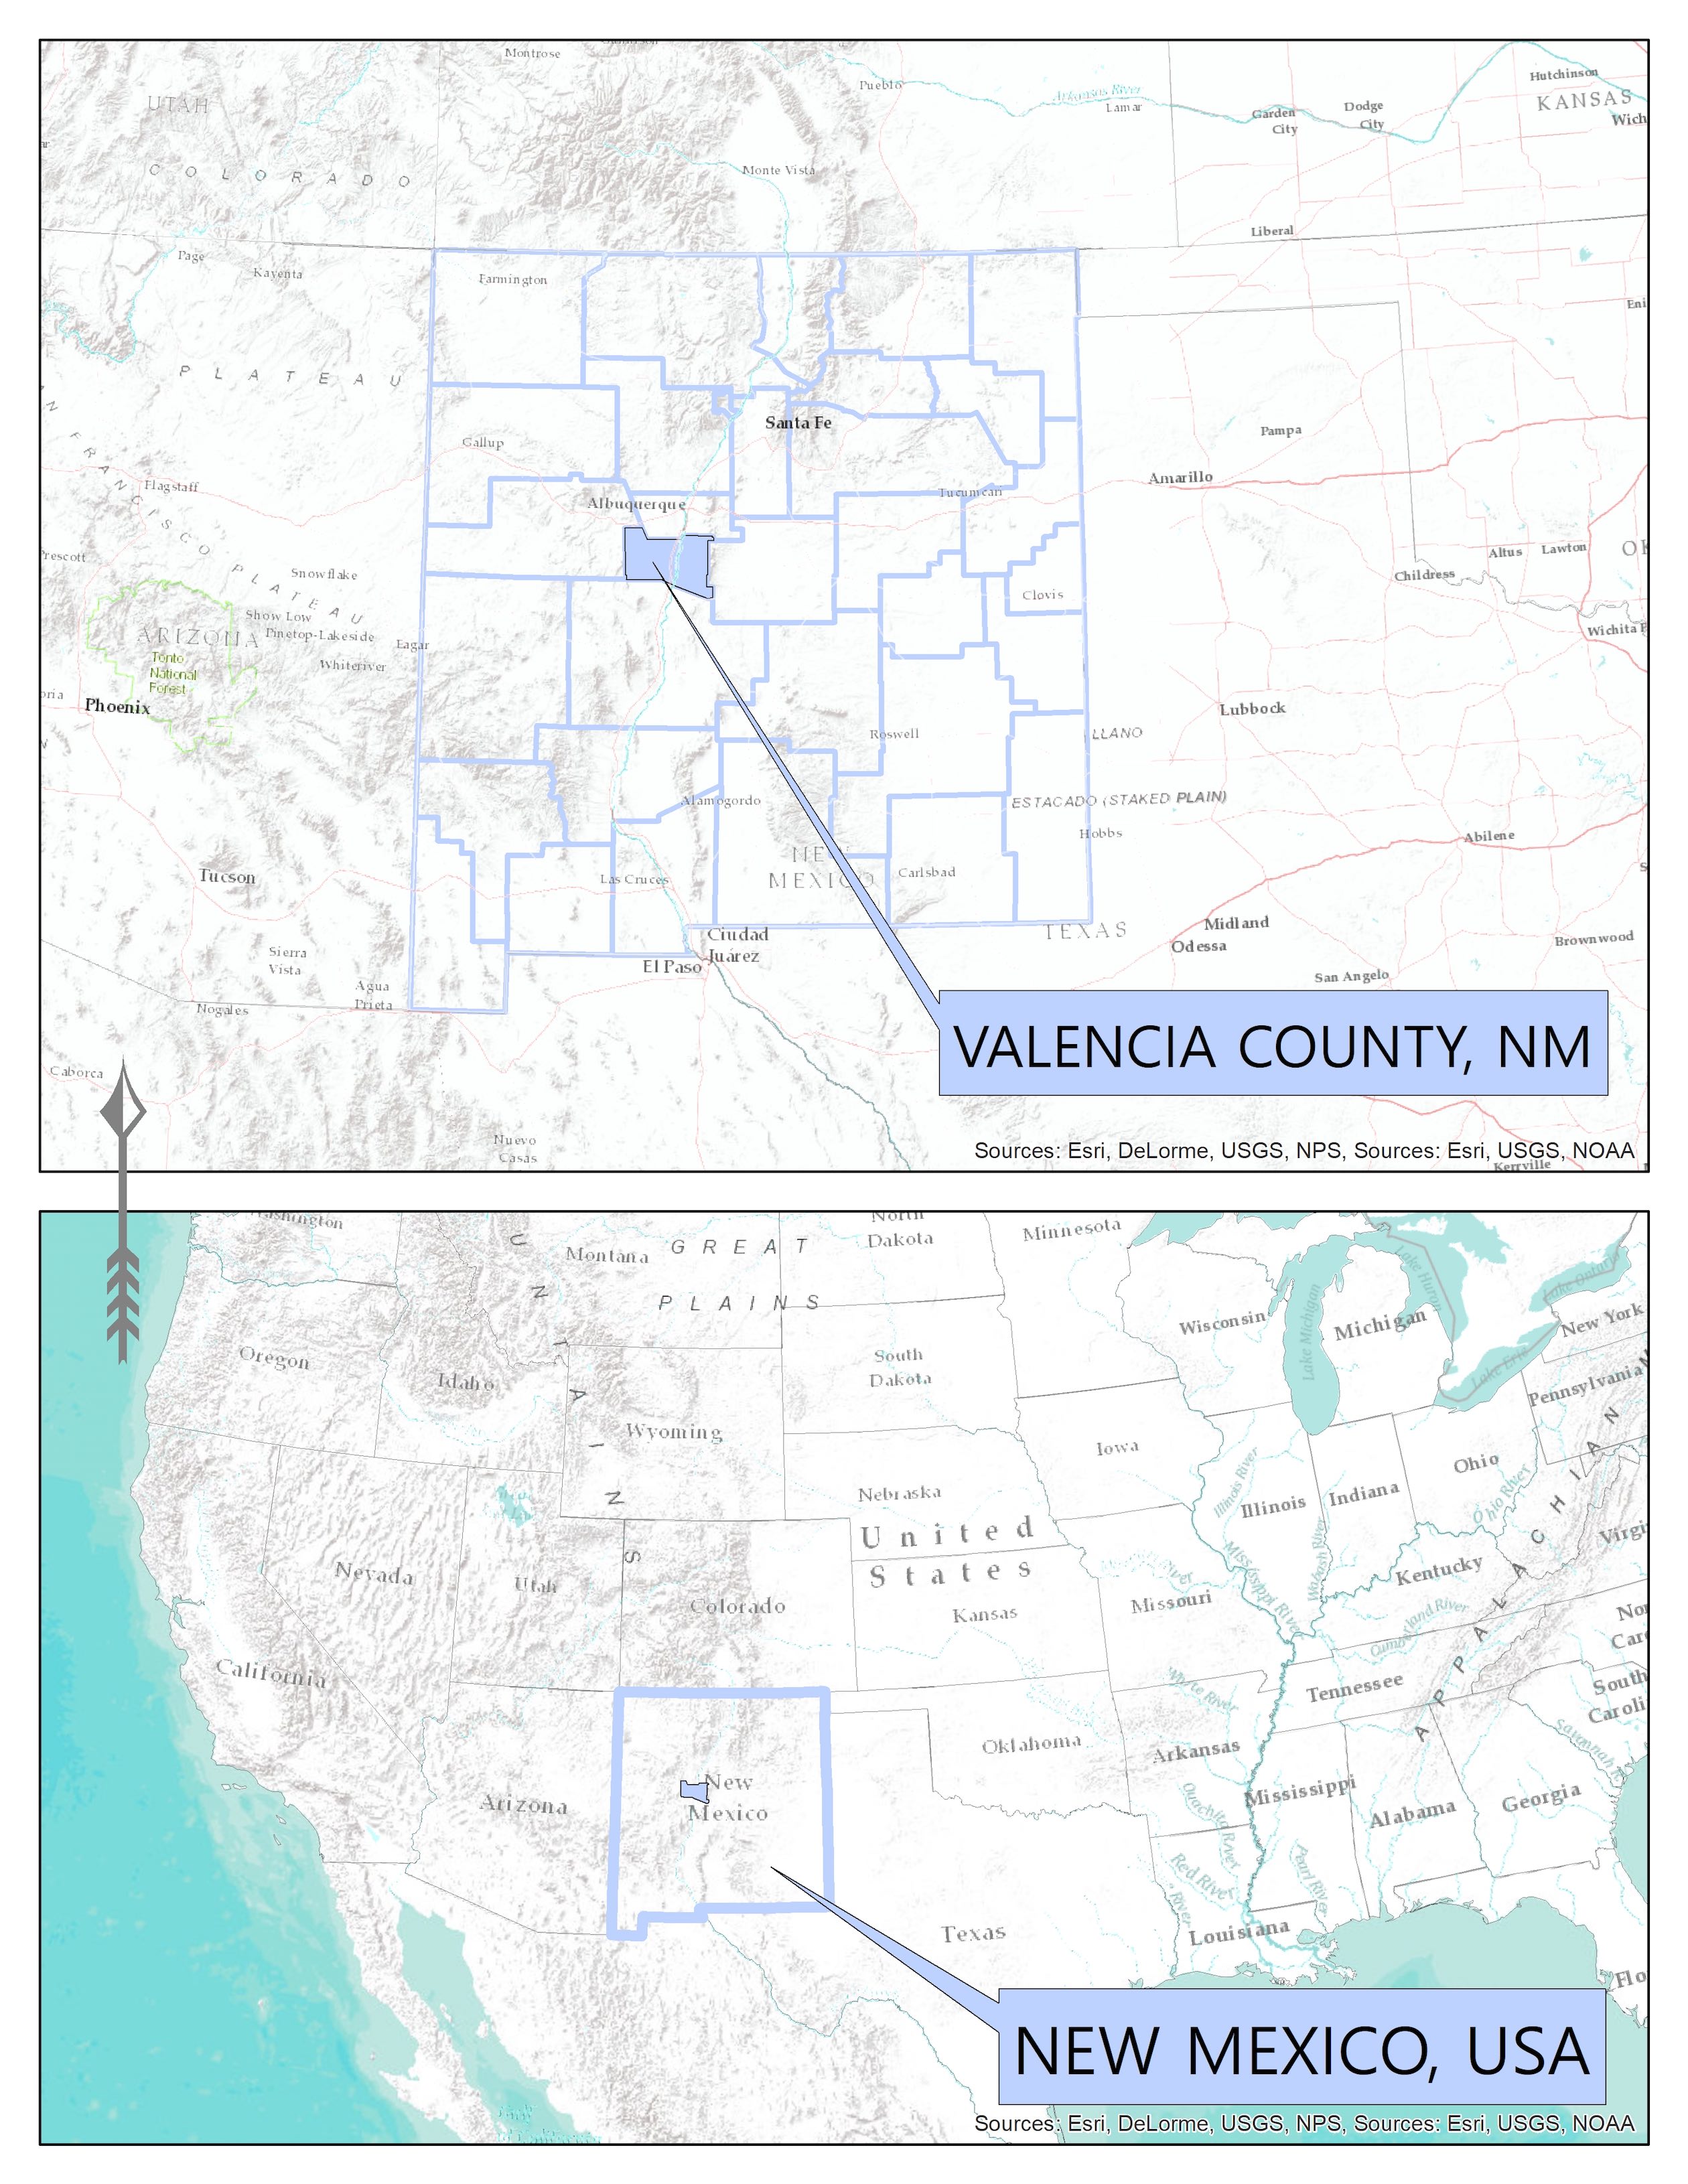
Cover CONTEXT | In this
homework Valencia county is south of Bernalillo county and the city of Albuquerque,
as seen in figure 2, with a population of 75,737 as of 2015. Valencia County
is one of the smaller counties in the state at 1,068 square miles in area.
The three largest cities are Belen, Los Lunas, and Bosque Farms. Agricultural
water use along the cultivated valley floor is managed by the Middle Rio Grande
Conservancy District. The cities and towns that dot the valley are farming
communities surrounded by cultivated crops, as seen in figure 1. Figure 2: Valencia County
Context Map OBJECTIVES | The
objectives of this study were to analyze cropland
productivity and crop types of Valencia County, to do an inventory of
cropland data available for this county, and to analyze the reliability of
crop data available for the Middle Rio Grande Valley. Five crops were
focused on with these objectives in mind, to keep the scope manageable and
more in depth, as well as to find crop types that were in each data set
utilized. Alfalfa(symbolized in blue) and corn(yellow) were selected as crop
types due to their prevalent nature in farming. Onions(purple), peppers(red),
and pecans(brown) were selected due to being crops of higher value, known in
the state of New Mexico, and typical for southern New Mexico as noted further
in future works. DATA | The
data that was used for this study was obtained from several sources. Cropscape,
USDA Census of Agriculture, Middle Rio Grande Conservancy District data for
Valencia County, Landsat data from USGS Earth Explorer database, and USDA
Geospatial Data Gateway were the primary sources. More
information and links to data sources can be found here. ANALYSIS &
RESULTS | Within Cropscape,
first a focus area was set for Valencia County to select only needed data,
starting from 2017 and selecting every three years working backwards to be
able to perform a temporal analysis. These crop and vegetation data sets were
then exported as tif files and imported into ArcMap. The symbology was sorted
several different ways to find the most efficient way to display only corn,
alfalfa, pecans, peppers, and onions for analysis for each year.
Figure 3: 2008 Cropscape Map for Valencia County For the
selected years of 2008, 2011, 2014, and 2017 there were unusual trends
county-wide that immediately seemed off, as seen in figure 4. For 2008, corn
was the trending crop when compared with the other years. In the year 2011,
the same held for peppers including peppers in the Rio Grande stream channel.
In the output for 2014, there was significantly less crops growing for all
crop types including alfalfa, and the symbology showed grasslands increased
over cultivated crops. Lastly, in 2017 alfalfa dominated the valley floor and
pepper were nowhere to be seen. Having expected the data to be accurate from
the USDA Statistics Service, the crop type changes seemed the opposite.
Farmers don’t typically change crop types county wide every few years and
pepper certainly were not being cultivated in the center of the river in
2011.
Figure 4:
Comparison of Cropscape results for Valencia County The data
was next checked against the USDA Census of Agriculture that is performed
every four years, which is arduous to analyze, being only available in PDF
form that is downloadable from their website(link in data sources page). The
only comparable year was 2012, as Cropscape did not have tabled acreage data
for 2008, being a newer online data service at that time. In comparing these
years for corn, the only comparable crop with full data in both data
services, it was found that Cropscape was indeed very inaccurate (see table
1).
Table 1: Cropscape and US
Census Comparison Table The next
analysis performed on Valencia County agriculture was to download Landsat 8
and study vegetation productivity using the Normalized Difference Vegetation
Index (NDVI). This Index is widely used for vegetation studies and drought
monitoring due to the ability to create a single-band data set that
essentially shows only biomass. NDVI can do this by zeroing in on
characteristics of red and infrared bands from a multispectral raster
dataset. The most recent year, 2017, was selected for analysis focusing on
December when cropland is dormant and comparing it to data from August, when
crops are at their peak(see figure 5).
Figure 5:
NDVI Results Overlaid with MRGCD Data Analysis To look
at the data from the Middle Rio Grande Conservancy District (MRGDC), the mdb
file provided was loaded into the same ArcMap workspace that had the Landsat
analysis. Corn and alfalfa were pulled out by selecting by attribute in the
data tables and creating a layer from those selected crops, each
individually. These layers were then displayed over the NDVI results for a
comparison of crop productivity to crop type, as seen in figure 5. No
definitive correlations could be made from this analysis comparison of crop
type and crop productivity. Clearly the cropland showed to be more productive
in the summer, as expected, but was relatively productive in places in the
winter also. CONCLUSIONS | There are
a few conclusions that could be made from these studies. One is that Valencia
County does indeed have a vibrant and productive cultivated valley, with a
wide variety of farming activity and crop types. Another conclusion is that
public crop data is not as accurate or as readily available as other
environmental or development data, which seems to be an issue given water
scarcity in the west and the fact that agriculture makes up 80% of water use
in most western states. This should be an area of more research and priority
for water managers and agencies. FUTURE WORKS | Read
about future works here.
|
|||||||||