 Amir Shokrollahi
CE 547
HW #1
The following images go over some of the basic functions of the ArcMap 10.3.1 application. These images were captured random and are only for demonstrating the visual format of the program.
The three exercises include: 1) Map Data Display 2) Map Navigation 3) Basic Tools
Displaying Map Data
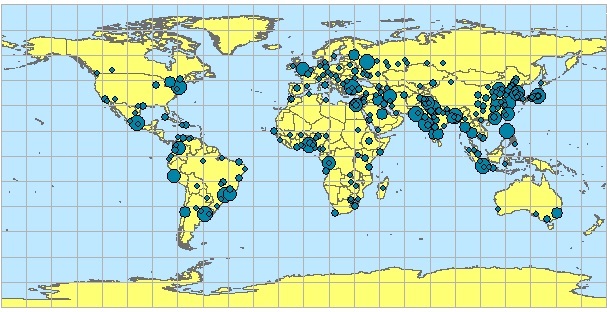
Blue
circles in the above image depict cities with populations over than 1million.
The circles grow larger as the populations increase. This layer could be turned
on/off at any time from the Layers toolbar.
Navigating Map
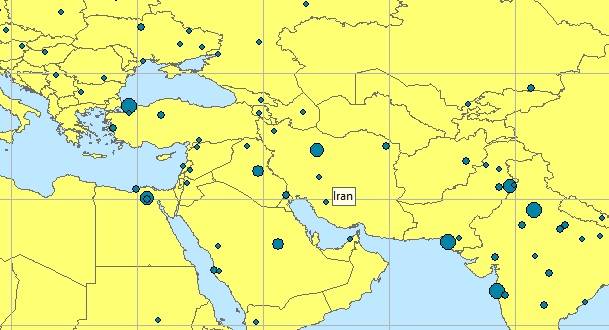
To navigate
maps in ArcMap the zoom tool was used in this example to locate the Middle
East, and specifically the country, Iran. The zoom tool could be found in the
top of the page toolbar.
Using Basic Tools
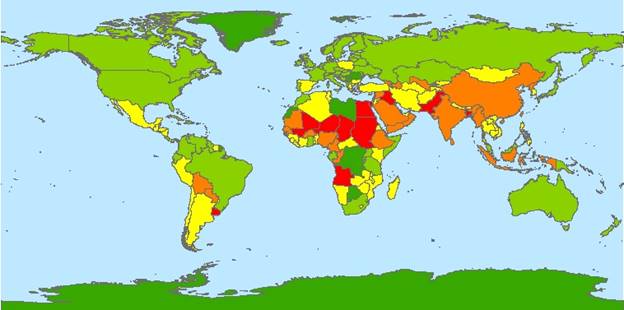
The image
above represents the data related to classifying countries based on their air
pollution level. The red color shows the highest level of pollution and green
is the lowest.