The first thing I did was to
create a website. My webpage would be hosted by UNM. It can be accessed by
going to unm.edu/~anathanielmoore, where anathanielmoore is my netid.
I created the homepage with a
picture, a link to the class website, a link to contact me, and links to future
homework assignments in Microsoft Word, and saved the document as a webpage.
I then used FileZilla, a free FTP
client, to upload it to the UNM server.
After that was complete I was
ready to move on and begin to explore ArcMap. I didn’t have the textbook yet,
so I used the “Explore A Map Feature” for ArcGIS Online.
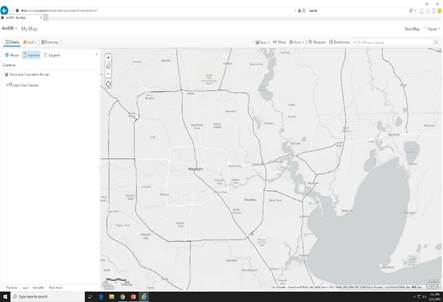
First, I opened a map in ArcGIS.
I then navigated to a specific area, in this case Houston, TX.
Using the ADD feature, I searched
the Living Atlas Database for Hurricane Evacuation Routes from a Federal
Database.
I added these to my map and
changed the base layer for my map so they would appear in bolder relief.
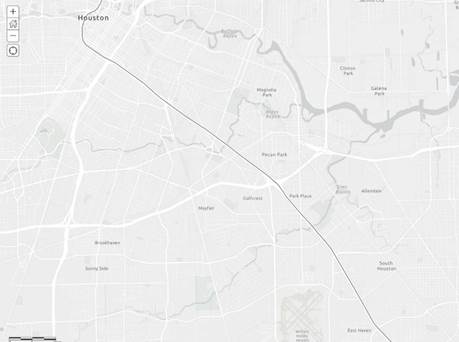
I then navigated to an area of
Houston that contains three bayous in close proximity and created a bookmark
labeled Houston Bayous
so that I could return to this
section of the map easily in the future.
I then used the Change Style tool
on the Hurricane Evacuation Routes map layer to make the routes stand out even
more.
I changed the color to a dark
blue and increased the line weight.
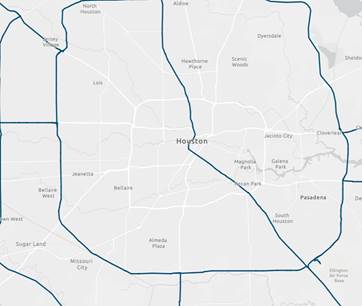
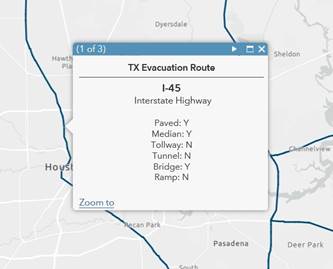
Clicking on any segment of the
routes will display information for that route. This info was added by the
creators of that layer.
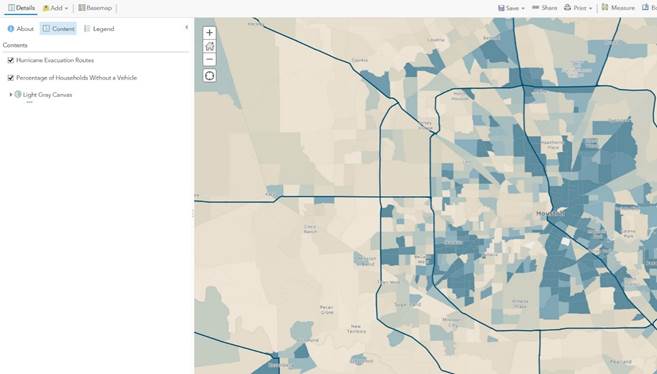
After that, I located census
tract data by searching for it in the ArcGIS Online database.
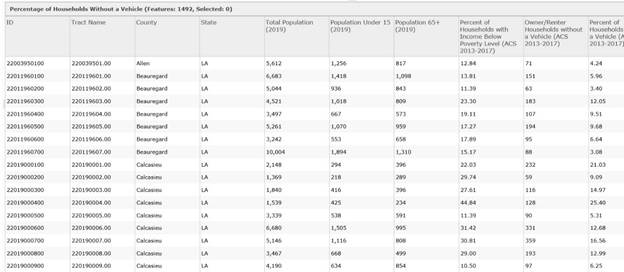
I added this layer and viewed the
attribute table.
Here I was able to locate one
column of information called Percentage of Households without a car.
The people living in these tracts
could be more susceptible to damage from a hurricane and may need more help
evacuating if one hits.
Next, I changed the style of this
attribute on the map the same way I changed the style of the evacuation routes
except that instead of changing a single attribute,
I scrolled down to change the
specific attribute feature, percentage of households without a car.
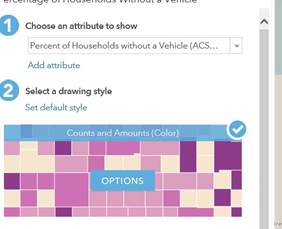
After this, the last thing I did was change the color option by clicking options, rename the census tract layer to Percentage of Households Without a Vehicle, and saved the map.