Methods
First, a research on different wildfires in New Mexico was done, to find 12 appropriate wildfires that happened within the past 23 years. This data was than eliminated, so that a conglomerate of wildfires from different locations of New Mexico and different sizes was chosen.
Once the coordinates of the chosen wildfire were determined, historical aerial photography was collected from the USGS Earth Explorer website data base. The photography was collected for each wildfire, so that the collection included an image before the fire and two images after the fire (first one within 3 years after the fire and second between 5 and 15 years after the fire). Some larger fires had even more aerial photography.
The GIS Analysis was made using QGIS computer program.
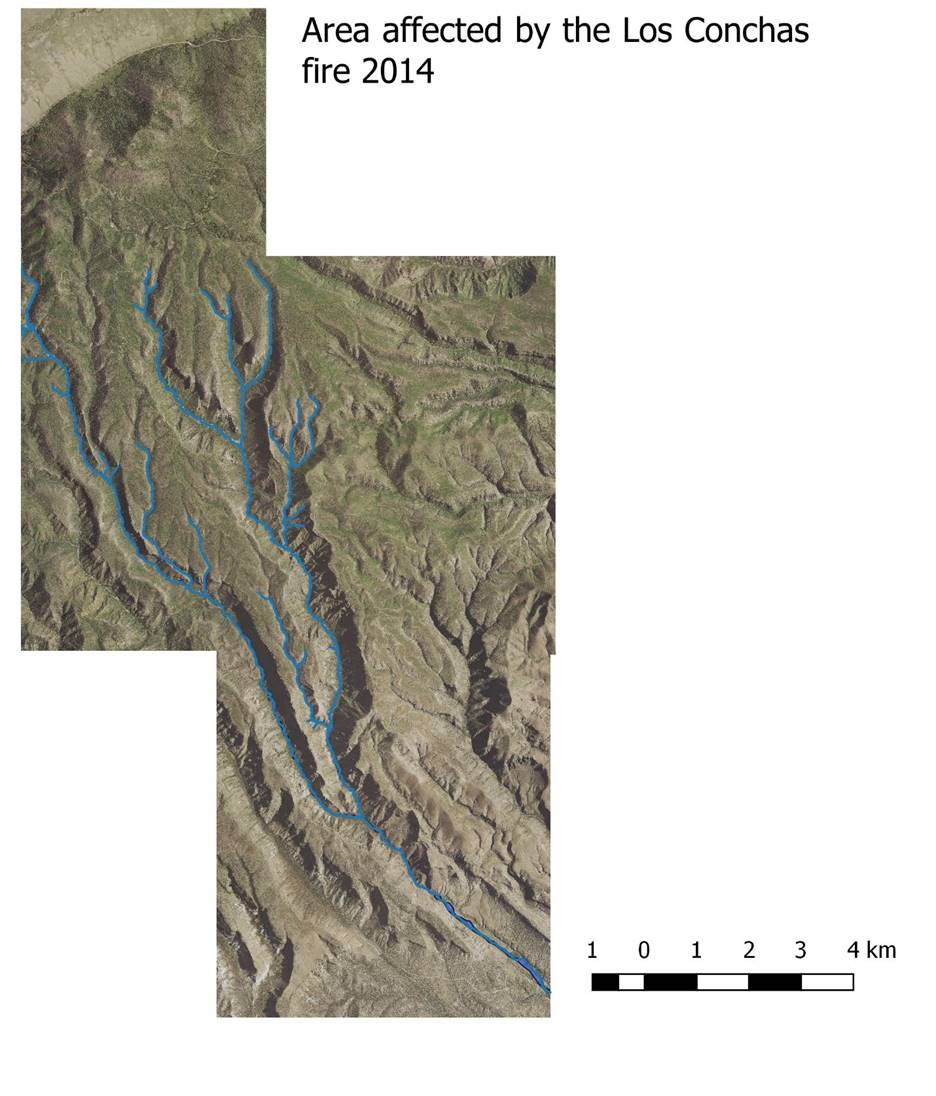
First, a channel centerline was created, by marking the middle of the active
channel on image after the wildfire. When marking the centerline, each stream
order was created separately and marked. This allowed us to observe the changes
in stream, within different stream orders.
Next, the active channel area was marked, by drawing
the polygons close to the edge of the channel. Once all active channels were
marked, a raster calculator was used to calculate the area of each part of the
stream.
Finally, area calculations were analyzed using
statistical software and separated in different stream orders. All calculated
areas from same stream orders were summed up and compared within different
years, the image was taken.