Anthropogenic Threats to Bee
Populations in New Mexico
Background and
Motivation
Bee populations have
been in the decline for decades, now down more than 60% since 1947 (Greenpeace,
n.d.). With the loss of bees comes the loss of invaluable pollination services
to about 80% of flowers, crops, and other plants worldwide. If the bee were to
go extinct, life as we know it would cease to exist. Pollination services would
mostly fall to humans, who would not be able to complete the task as
efficiently (or as inexpensively) as their insect counterparts, and food
shortages would become the new norm. Unfortunately, these serviceable creatures
face many threats, including parasites, diseases, and other predators. The top killers
of bees, however, are legacies of man: habitat fragmentation, monoculture
farming, and pesticides.
Objective
The purpose of this
project was to gather and interpret data about the history and present status
of habitat fragmentation, monoculture farming, and pesticide use in New Mexico
to predict future statuses of these three aspects. Using the future projections,
I will then assess the severity of threats to bee health in the state.
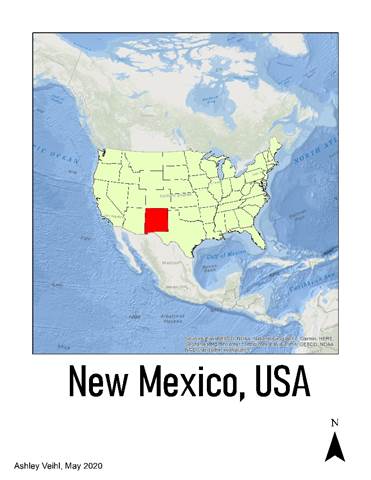
Fig. 1. The focus
area, New Mexico, USA.
Methods
All shapefile data was
found on ArcGIS Online. Content data was found from various sources. Because all of the maps I made were of New Mexico, I chose the
projection of NAD_1983_2011_Contiguous_USA_Albers. Changing the central
meridian to 106W helps the state of focus to not appear “short and squatty”. All
maps were made on ArcMap 10.7.1.
Results
The map depicting
magnitude of habitat fragmentation showed that in the southern and eastern
areas of the state, fragmentation was relatively low. This certainly makes
sense for the southern region, as it is mostly desert and development in this
area has been slow. The eastern biome isalso Chihuahuan desert mixed with Western short grasslands.
While these two areas are relatively low-risk, the majority of
the state is in the medium-high range of fragmentation magnitude. This includes
biomes of Arizona mountainous forest, Colorado plateau
shrublands, and Colorado Rockies forests. The high magnitude of fragmentation
for these habitats means that the natural spaces that the bees must travel to
become fewer and far in-between, increasing difficulty of finding viable food
sources and mates, and decreasing genetic diversity and, in turn, resistance to
disease and parasitism (Naug, 2009).
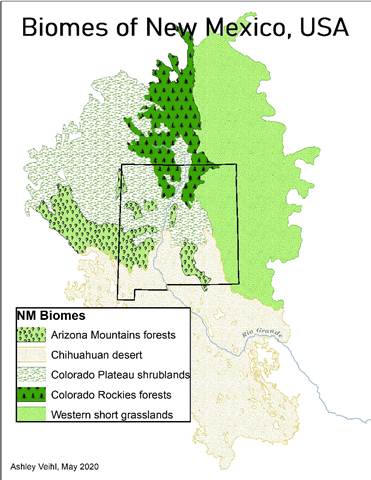
Fig. 2. Biomes of New
Mexico, USA.
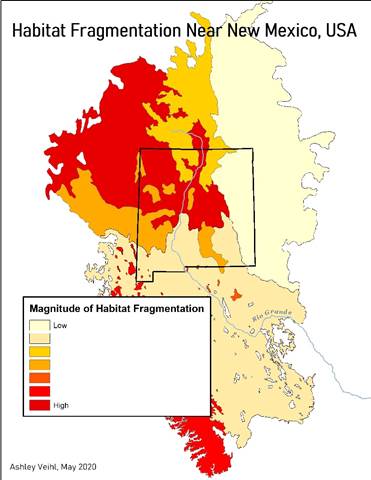
Fig. 3. Magnitude of
Habitat Fragmentation in New Mexico, USA.
The map of crop
patterns in New Mexico indeed shows a problem of monoculture farming. The vast majority of the state appears to be monopolized by
only six types of crops, with the top three (alfalfa, corn, and pecans)
accounting for the better part of that majority. Lack of diversity is
problematic because it results in a uniformed flowering time for the crops,
meaning there will be an abundance of food for the bees for a short period of
time, and then an extreme food shortage over a large area after this period
(Donaldson-Matasci, 2013).
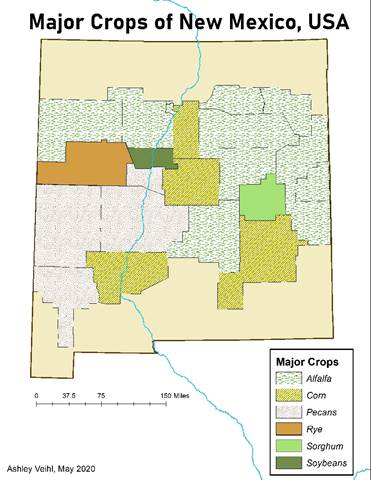
Fig. 4. Major Crops
by Area in New Mexico, USA.
The pesticide use
data showed an interesting progression from 1992-2009. Pesticide use in almost
every county increased by 1997. By 2009, some counties had somewhat curbed
their pesticide use, though overall, New Mexico was spraying more pesticides in
the most recent year than in the earliest. This is detrimental to bee
populations, as pesticides are not only toxic to bees themselves, but they
decimate potential food sources for the bees.
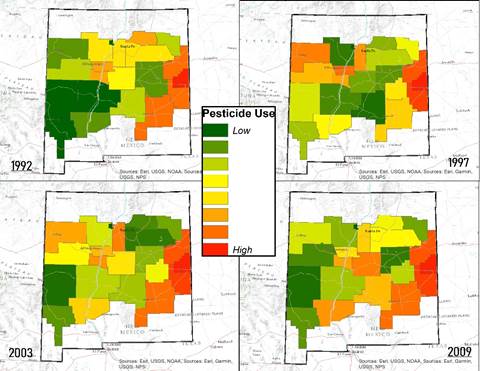
Fig. 5. Pesticide Use
from 1992-2009 in New Mexico, USA.
Conclusion
Habitat
fragmentation, monoculture farming, and pesticide use are three major threats
to bee populations. Unfortunately, all three of these are occurring in New
Mexico, and unless there is a major shift in agricultural practices, bee
populations will continue to be decimated, potentially irreversibly so.
According to a study by MIT, if bee populations drop to a level where crops
need to be hand pollinated by humans, it could cost upward of $2.6 trillion
annually to do the work that bees do for free (2015). A future without bees is
unimaginable, so an agricultural reform needs to happen soon.
Future Work
If this study were to
be replicated, I would encourage a deeper look into the data for pesticide use
and habitat fragmentation. The data included in the shapefile used specific
numbers, but without units or other numbers to compare it to, it’s somewhat
irrelevant. In addition, a more in-depth look at crops in New Mexico would be
helpful. Because the data for major crops was by acreage, it left out certain
crops, giving the maps a less-than-full scope. I would also like to get data on
actual bee populations in the state in order to compare them to the results and
predictions of this project.
References
(2015). In Mission 2015:
Biodiversity. Retrieved May 8, 2020, from https://web.mit.edu/12.000/www/m2015/2015/bee_tech.html
ArcGIS Online. (2017). Pesticide Use by
author jsc2245_columbia. Retrieved through ArcMap on 05/04/2020.
Donaldson-Matasci,
M. (2013, June 7). In Honeybees and monoculture: nothing to dance about.
Retrieved May 8, 2020, from https://blogs.scientificamerican.com/guest-blog/honey-bees-and-monoculture-nothing-to-dance-about/
Greenpeace. (n.d.).
In Save the Bees. Retrieved May 5, 2020, from https://www.greenpeace.org/usa/sustainable-agriculture/save-the-bees/
Hoekstra, J. M., J. L. Molnar, M.
Jennings, C. Revenga, M. D. Spalding, T. M. Boucher,
J. C. Robertson, T. J. Heibel, with K. Ellison. 2010.
The Atlas of Global Conservation: Changes, Challenges, and Opportunities to
Make a Difference. Ed. J. L. Molnar. Berkeley: University of California Press.
Naug, D. 2009.
Nutritional stress due to habitat loss may explain recent honeybee colony
collapses. Biological Conservation 142: 2369-2372.
Appendices
Beginning with
habitat fragmentation, I first made a reference map of New Mexico and the
different biomes within it. I overlaid a map of the United States over the
habitat fragmentation layer, then used a definition query to exclude every
state other than New Mexico. I then used the selection features to get rid of
all biomes other than ones inside of the state. I changed the symbology so that
the biomes reflected something close to how I feel they would appear in real
life. As I did in all the maps (other than Fig. 1.), I added the Rio Grande for
reference. I then included a legend and a title.
Next, I did many of
the same things as above to create the fragmentation magnitude map. Once I had
only the habitats inside of New Mexico, I changed the symbology to get darker
with increased risk of fragmentation. For this legend, I used a scale of “low”
to “high” instead of exact numbers because without something to compare these
numbers to, they didn’t make much sense.
For the monoculture
farming map, I first uploaded the Pesticide_Use
shapefile, which also contains data about crops. I again used a query builder
to exclude all U.S. states other than New Mexico, then used the select by
features/location tools only include crops in the state. This came out cleaner
than the previous maps because the data is by state rather than by region. I
again changed the symbology to reflect the different types of crops, making the
top 3 patterned to stand out, and leaving the rest as solid colors. I also
rearranged the order of the crops so that the top 3 by area would be first in
the list on the legend. I lastly added a scale bar and titles.
Lastly, for the
pesticide map, I began again by uploaded the Pesticide_Use
data from ArcGIS Online. After using the query builder and selector tools to
isolate New Mexico and its pesticide use by county. Pesticide use data in this
set goes from 1992-2009, so I made four different maps, identical except for
changes in pesticide use, which was shown by changing the symbology to go from
green to red, with red indicating a higher use. Again, in this legend, I used
references of “low” and “high” to avoid confusion with using the actual data
with no frame of reference to compare them to. I put the four maps together in
order of progressing dates, added the same base map to them all, then put the
legend in the middle and added a title.