Homework #2: Pan Evaporation in New Mexico
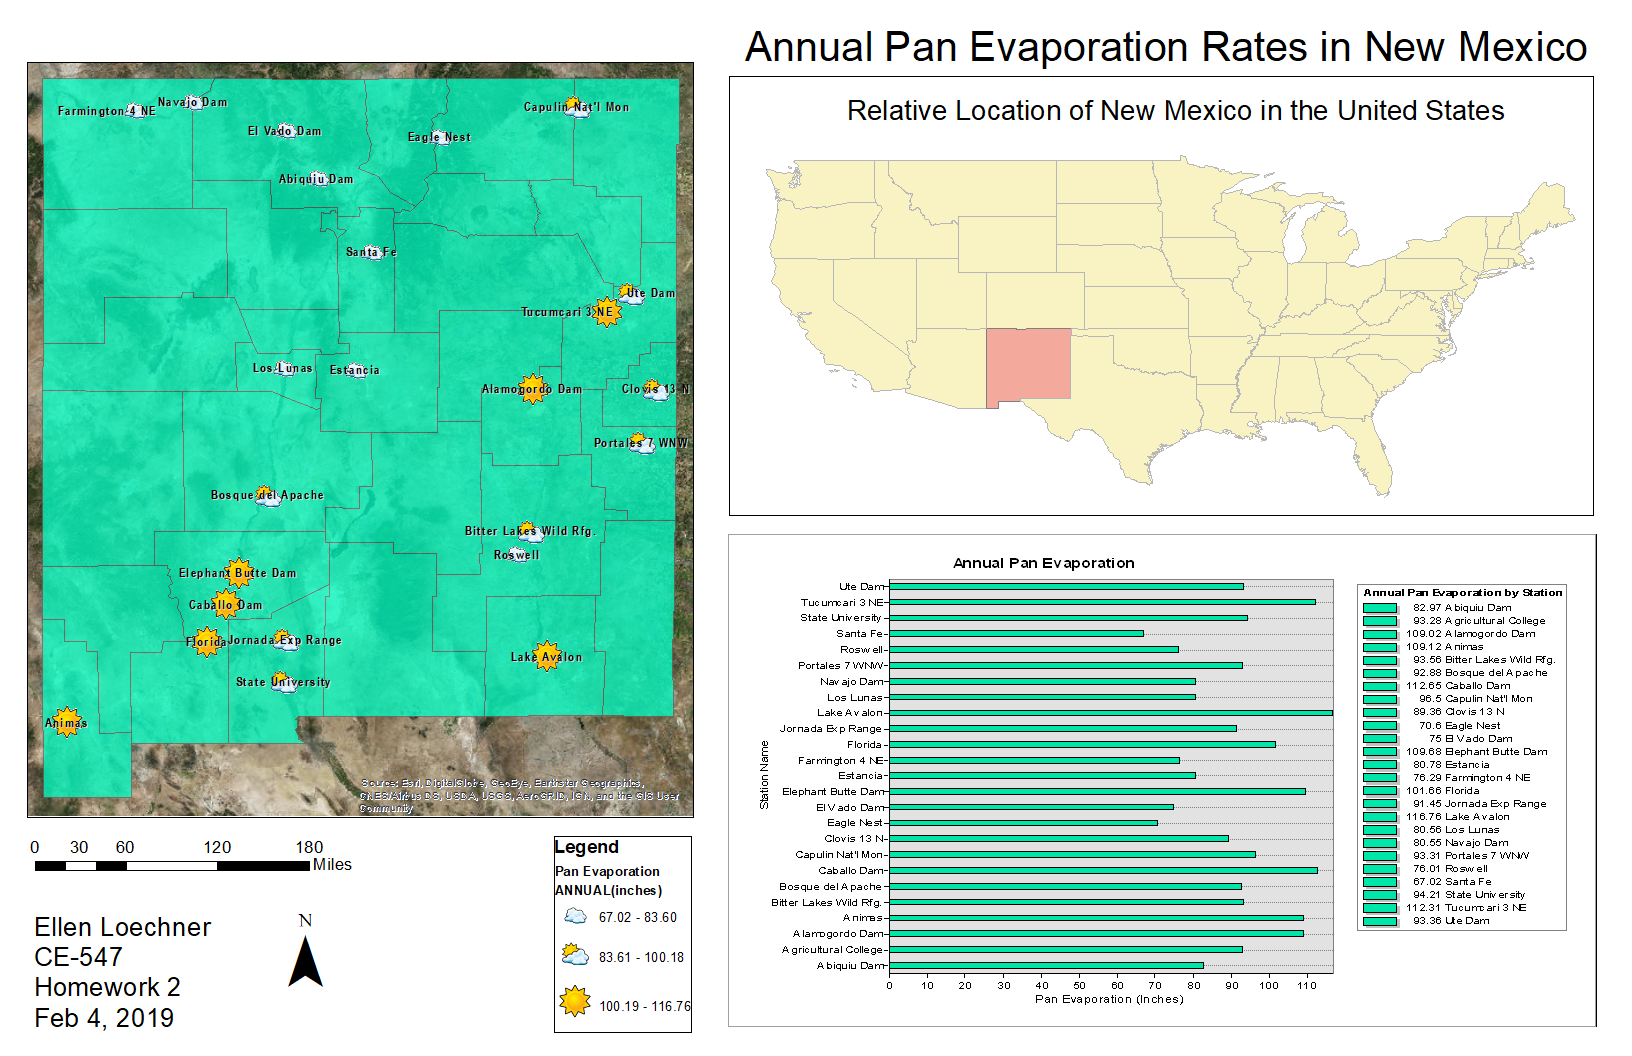
The map layout below shows the annual pan evaporation in New
Mexico at different measurement stations The sun icons show stations with the
most annual pan evaporation, partly cloudy icons represent intermediate annual
pan evaporation, and the cloudy icons represent the least annual pan
evaporation. —See legend for exact ranges. The graph shows the annual pan
evaporation for each station (in inches). The map in the top right corner shows
New Mexico’s relative location in the United States.