The Vegetation History of Middle Rio Grande
River Bars
Objective
To examine the vegetation
history of currently vegetated island and side bars in the Albuquerque reach of
the Rio Grande, with particular attention to the differences between native and
non-native dominated bars.
Motivation and
Background
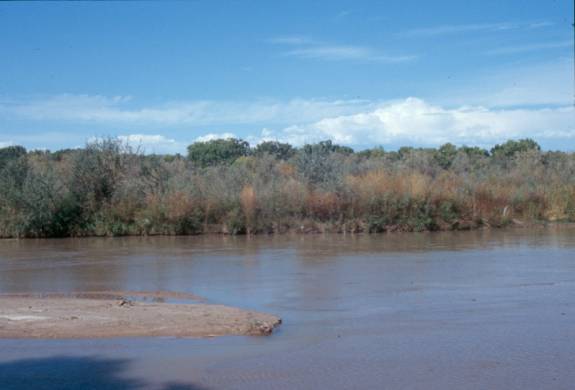
I became interested in and concerned about the future of river bars through a five-year study (1998-2002) conducted at New Mexico Natural Heritage Program (NMNHP) on the biology of river bars in the Middle Rio Grande. Through that work it became clear that river bars are an important part of the Bosque ecosystem, providing a great deal of biological value through species richness, habitat diversity, wildlife habitat and as nurseries for native woody species (Figure 1). Two of the major unanswered questions we have about the river bars is when were they established and are there significant age differences between bars dominated by native and non-native vegetation? Other important questions about the history of the river bars are how has the amount of area occupied by bars changed in the measurable past and what have the trends in bar dynamics been over that time period? In 2002, to better understand the current status of river bars, I created a map of Rio Grande river bar vegetation for the Albuquerque reach using imagery from 1999 (Figure 2, below).

Figure 2. Example from the 2002 River Bar Map. Complete report, map and associated shapefiles are avalible from the NMNHP web site at: http://nmnhp.unm.edu source code U03MIL01NMUS
Methods
Data Sources: 1.
Orthophotograhs of the aerial photographs of the Rio Grande from 1935, 1951 and
1973. (Acquired from Earth Data
Analysis Center) 2. Map of current
river bar vegetation created in 2002 (created in-house at NMNHP). 3. Maps of historic river bar vegetation,
created for project from 1935, 1951 and 1973 orthophotographs.
Projection used: UTM NAD27 Zone 13, because the area being studied is fairly
small, is oriented north-south, and because the current vegetation map was
created in that projection.
Software: ArcMap was used for all
mapping and spatial analysis, MS Excel was used to make the graphs. The orthophotographs on which the maps were
based were rasters, but all of the maps were created as polygon shapefiles.
Analysis: First I created maps of the historic vegetation along the river
from the 1935, 1951 and 1973 aerial photographs. Within the next year I plan to create historic vegetation maps
for the reach from Bernalillo to the I-25 bridge. However, in order to complete some analysis in time for the
project deadline, I mapped only the reach from the I-40 to the Barelas bridges
(Figure 3). The orthophotographs are in black and white,
and of varying scales, which made mapping the vegetation a bit of a challenge (Figure 4). Although I was not able to determine the
vegetation to the level of species (and thus exotic or native) I was able to
determine the lifeform of the vegetation (trees, shrubs, herbaceous or
non-vegetated soil). For this analysis
shrub and herbaceous vegetation were grouped together as they both represent
‘bar type’ vegetation.
Once I had created the maps I used them to first
create some descriptive summary data on vegetation within the levees for each
of the mapped years. I used XTools for
ArcMap 8.x Version 3.1[1]
to calculate the areas for all of my map polygons, and then to sum the areas by
vegetation types. I exported these sums
to Excel where I created graphs showing the change in amount of area occupied
by vegetation types across years. To
examine the vegetation history of the current river bars I clipped the historic
vegetation maps to just the extent of the current riverbars, then compared them
side by side. Finally, to look at
change in vegetation within the entire inter-levee floodplain I intersected the
historic vegetation maps in pairs, 1935 to 1951, 1951 to 1973, and 1973 to
2002. I then used XTools to calculate
the areas of the intersected polygons, sum them by intersection type and again
exported that data to Excel to graph.
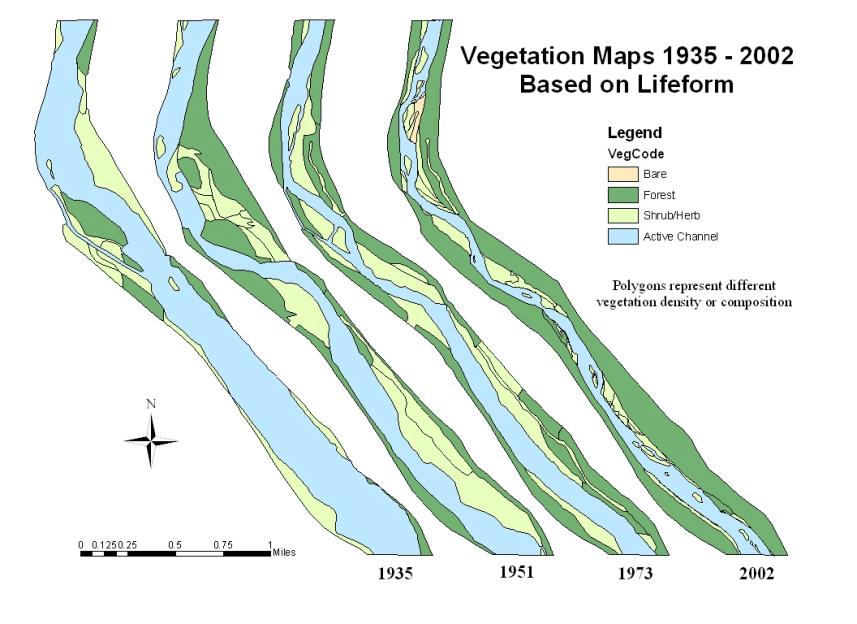
Figure 5. Historic and current vegetation maps for reach from I-40 bridge to Barelas bridge.
Results
Looking at the vegetation maps it is obvious that a
great deal more change occurred in the total area occupied by, and in the
distribution of, vegetation types between 1935 and 1951 and 1951 and 1973
(Figure 5, above). However, between
1973 and 2002 there was hardly any movement of existing terraces and sidebars,
only aging of the vegetation already in place, so that most of the vegetated
areas from 1973 have become mature forest.
Those areas that were bar in 1973 and still occupied by shrub/herbaceous
vegetation in 2002, are mostly exotic (Russian olive) dominated bars, while the
few bars that are ‘new’ in 2002, are mostly dominated by native vegetation[2]
(Figure 6, see below).
The only major structural changes between 1973 and
2002 are those of additional island and sidebars, making a narrow channel that
much narrower. When I graphed the
percentage of available inter-levee floodplain area occupied by each vegetation
type, a clear trend of decreasing active-channel width, and increasing mature
forest is apparent (Figure 7). Percentage of area occupied by
shrub/herbaceous vegetation increased to a peak in 1951 and has greatly
decreased since 1973.
The intersection maps of 1935 to 1951, and 1951 to
1973 show how much movement was taking place between vegetation types within
the floodplain prior to 1973 (Figures 8). Especially noteworthy is the amount of
change in status for areas occupied by shrub/herbaceous vegetation (either into
forest or from active channel), and the fact that prior to 1973 at least some
areas occupied by forest converted to active channel or shrub/herbaceous vegetation
(Figure 9).
Examining only the prior history of our current river bars it is interesting to note that portions of many of them have moved in or out of the active channel several times. For example, some areas that were occupied by forest in 1935 were occupied by active channel in 1951, and finally by shrub/herbaceous vegetation in 1973 (Figure 10).
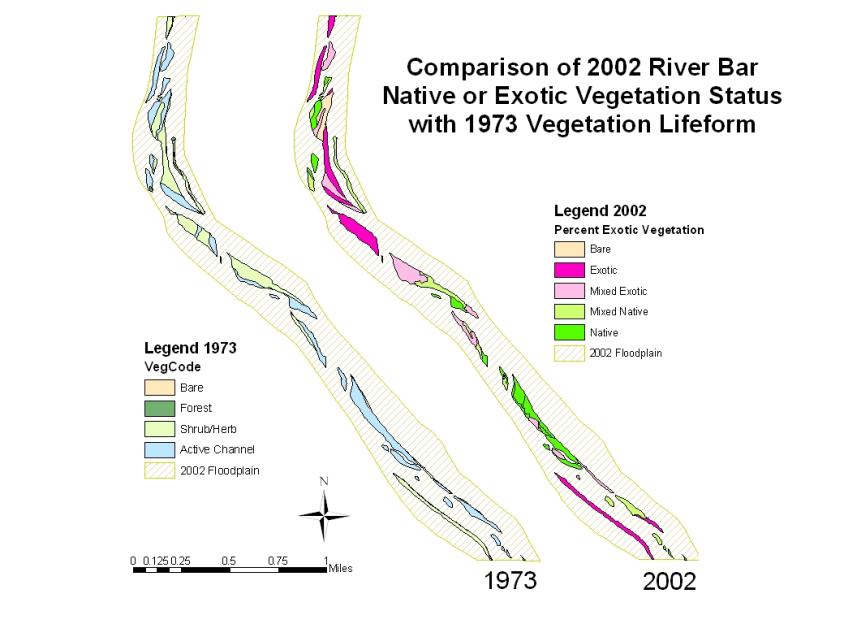
Figure 6. Historic vegetation lifeform status from 1973 clipped to extent of 2002 river bars on the left with exotic or native-dominated status of 2002 river bars on the right.
Conclusions
The most obvious conclusion from this project is
that the vegetation within the current floodplain has become ever more
stagnant. The area enclosed within the
levees in 1935 was nearly all active channel, which makes it difficult to
assess what percentage of the original pre-levee river system was occupied by
shrub and herbaceous vegetation.
However, it is clear from the 1951 and 1973 vegetation maps that prior
to the closing of Cochiti Dam there was much more movement within the
floodplain of both the channel and the vegetation zones. Perhaps, as more is learned about the
river’s biology and hydrology, some of this movement can be reintroduced into
the system with creative restoration and engineering projects.
Future Work
One thing that became clear as I worked with my
three historic vegetation maps is that 16 to 29-year gaps between maps is too
large to make definitive statements about the historical condition and origin
of the current river bar vegetation.
Thus, I plan to broaden my scope to map the historical vegetation from
1960s, 1980s and 1990s photographs.
Also The mapped area will be extended to include, at a minimum, the
entire area from Bernalillo to the I-25 bridge. This should provide enough area to do some meaningful statistical
analysis on trends in vegetation change.
To Elizabeth’s Home Page To Class Home Page