Homework 2
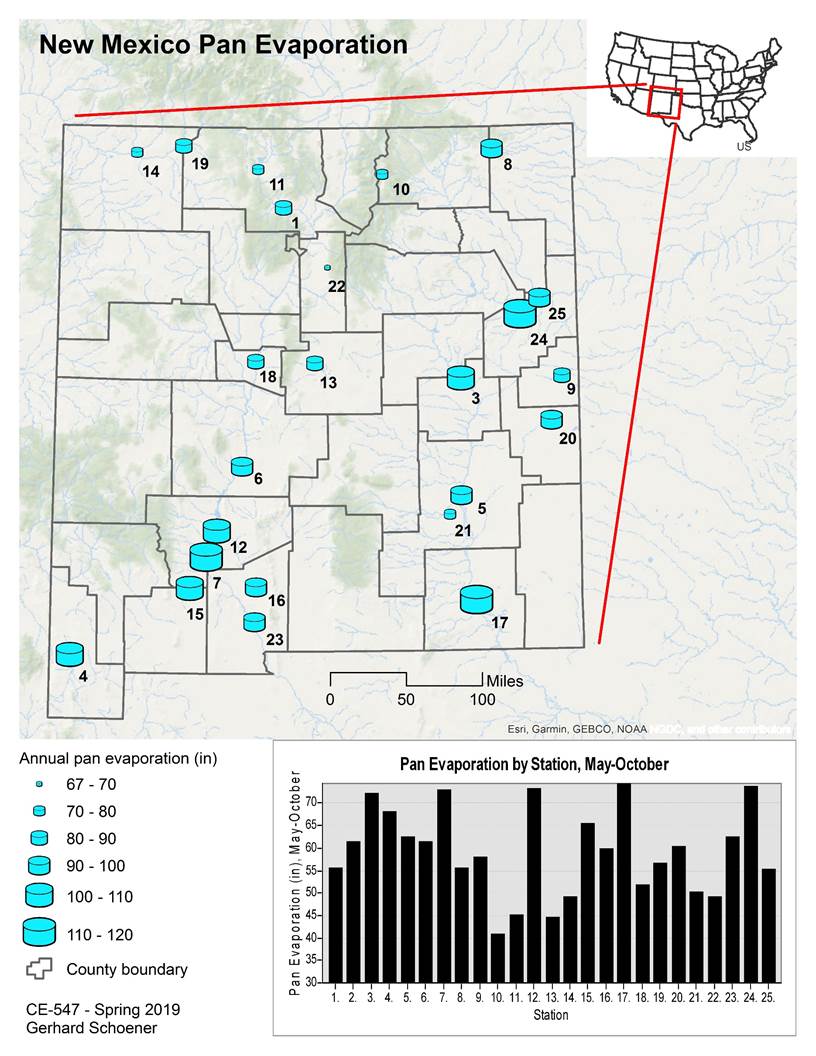
The map below shows pan evaporation data for different
sites across New Mexico.
Numbers on the map correspond to station IDs in the bar chart.
Homework 2
The map below shows pan evaporation data for different
sites across New Mexico.
Numbers on the map correspond to station IDs in the bar chart.