Comparison of Satellite-Based Soil Moisture
Estimates
and Rainfall Data for a New Mexico Watershed
Background Study Area
Data
Methods Results &
Conclusions
To compare rainfall
and soil moisture data, 31 SMAP grids for the month of August 2018 covering the
study area were loaded into ArcGIS. Time
increments between SMAP data grids vary between approximately 11 and 37 hours
(see Figure 4, orange boxes). Point precipitation data from tipping bucket
gages was examined, and eight storms were identified during the study period
(Figure 4, blue arrows).

Figure 4:
SMAP grids (orange) with corresponding time stamps (UTC) and measured
cumulative precipitation between consecutive grids (blue arrows).
Soil moisture values
for each time increment and three grid cells were extracted in ArcGIS, and changes
in soil moisture between subsequent grids were calculated. Figure 5 shows an
example for August 22-23, 2018 for grid cell 1. Soil moisture in the indicated
grid cell (yellow outline) changed from 0.07 to 0.18 m3/m3,
a positive change of 0.11 m3/m3.
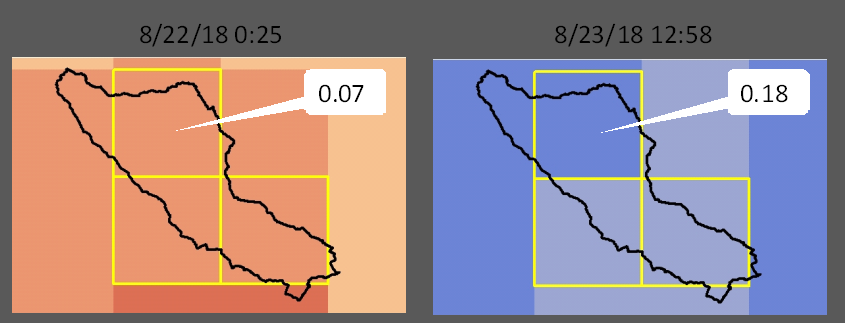
Figure 5:
Example of change in soil moisture (m3/m3) for one grid
cell between two subsequent SMAP grids.
Zonal average
precipitation was calculated for the time periods between subsequent SMAP
grids. Figure 6 shows cumulative rainfall for the SMAP grids displayed in
Figure 5.
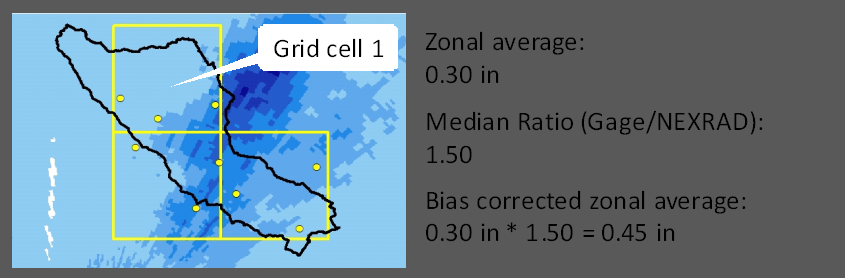
Figure 6:
Example of accumulated rainfall in grid cell 1 for the time period between the
SMAP grids shown in Figure 5.
NEXRAD precipitation
data are often biased (i.e. systematically higher or lower than ground
observations). Rain gages were therefore used for bias correction. To
accomplish this, accumulated precipitation for each storm was extracted from
the NEXRAD grid at each gage location (see Figure 6, yellow circles) using
spatial analyst tools. Figure 7 compares NEXRAD and rain gage data at each gage
location for the August 22-23 storm. The comparison illustrates that – with some
exceptions – gage data was higher radar-derived rainfall estimates. NEXRAD
zonal averages for each grid cell were therefore scaled using the median ratio
of gage and radar data (in this case 1.50).
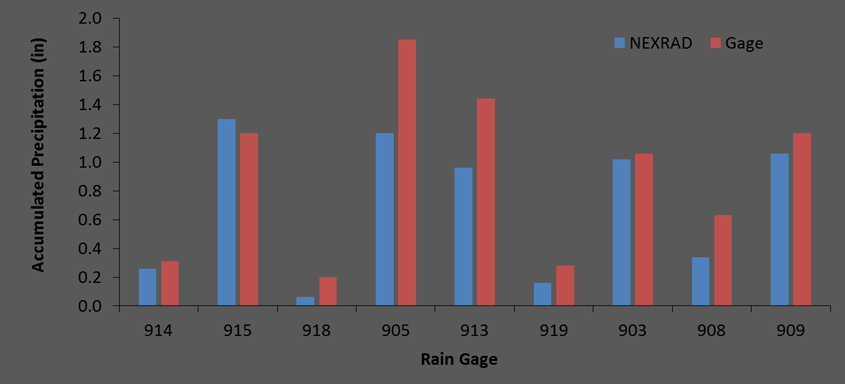
Figure 7:
Comparison of rain gage (red) and NEXRAD (blue) precipitation accumulation for
the storm of August 22-23, 2018.