Homework One:
Part 1:
For our first assignment we
started with creating a class homepage using UNM as our domain. To accomplish
this we used Word to origionaly create the web page design. After, the word doc
was saved as a web page (html). Using filezilla we connected to UNM’s domain and
created a public_html folder to house our files. After uploading both the saved
html doc and the folder named “index_files we changed the preferences to 755 and
set authorization features. Once that was finished our page was posted and we
could type the webpage address to make sure it was working.
Part 2:
I created an ArcGIS Online
map in association with ArcGIS Online website. Once in the map I called up I navigated
to the assigned area of interest, which was Huston. Then I started adding the
directed layers in Living Atlas Layers; Hurricane Evacuation Routes. Then I
changed the base layer to the indicated Light Gray Canvas. Indicated the designated
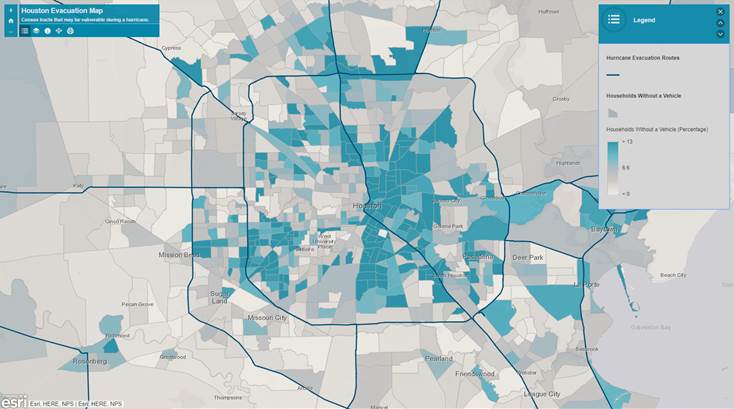
graphic details of the relief routes. Then I added the demographic layers; Houston
Census Tract Demographics and reordered the layers so that the relief route is
shown on top. Then added the Percent of
Households without a Vehicle attribute table to the catalog menu and added a
color scale to better show the areas that may be at more risk; represented in
the map below.
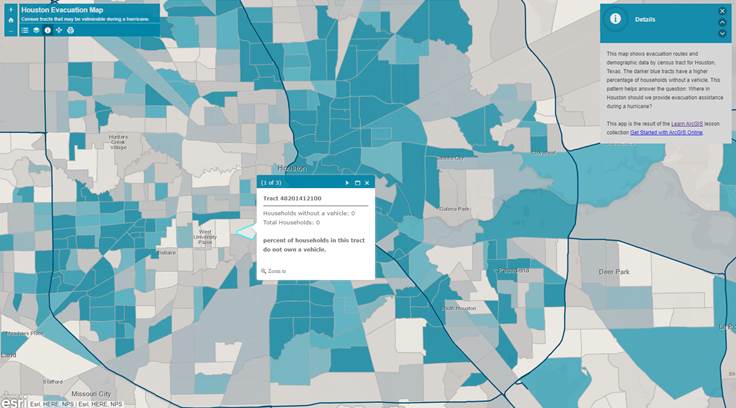
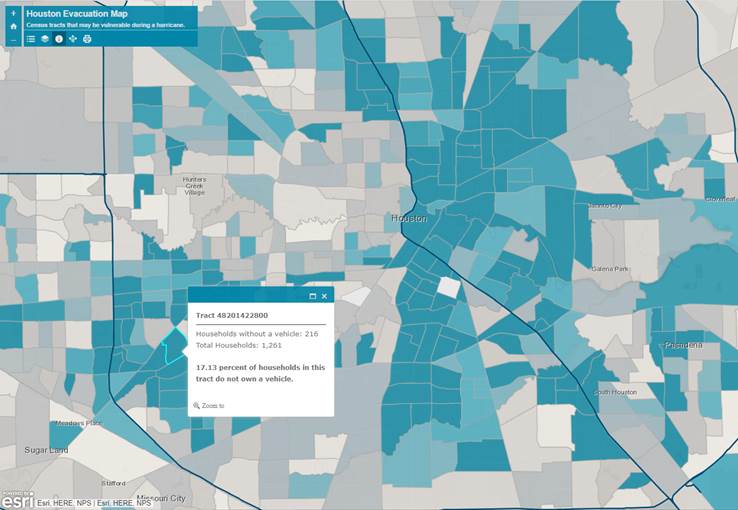
Now, for each of the indicated neighborhoods you can select and see the number of households’ w/o a vehicle and the total number of households. It also displays the percentage of households that may be at higher risk due to the fact that they do not own a vehicle.
The map also displays the data where nothing existed in the Percent of Households without a Vehicle attributes table, shown below.