Hanttula Assignment 2-We were provided with the files that correspond to New Mexico Counties and the pre collected pan evaporation data. With this we could look into scalable comparisons depending on the individual(s) preferences.
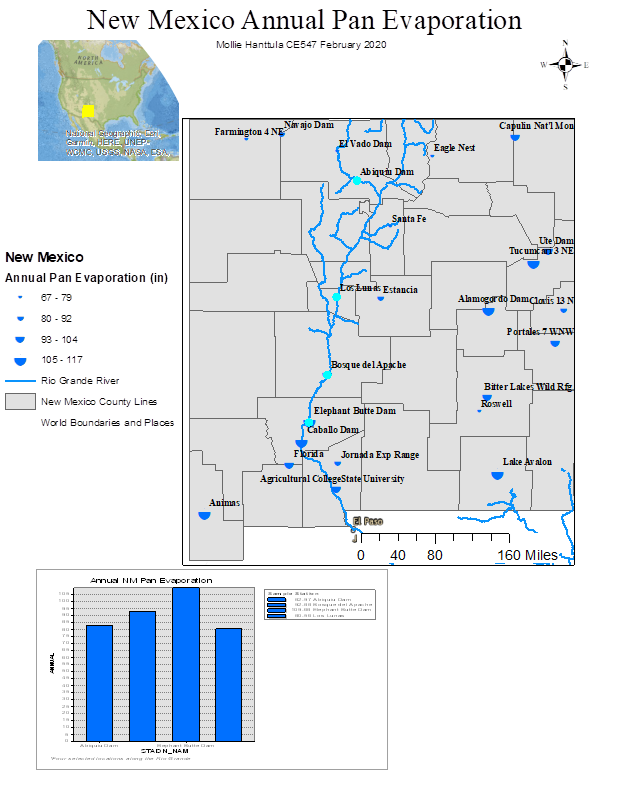
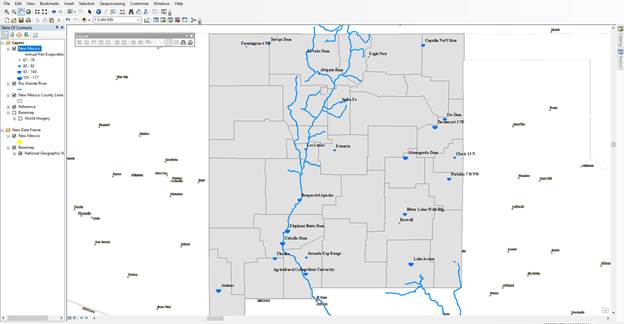
For this Assignment I wanted to look further into the annual pan evaporation along the Rio Grande. I chose four sites to compare depending on placement (i.e. must be along the Rio Grande and there must be at least one representative of the Upper Rio Grande, Middle Rio Grande, and Lower Rio Grande. To accomplish this, I needed a way to represent the Rio Grande and somewhere to find it. Because it is a geological feature generally it is easy to find. In this case I checked a few government agencies and found it from USGS (https://www.sciencebase.gov/catalog/item/58e53848e4b09da679997cef). When looking for shapefiles the easiest way to start is to just google what you need and know what kind of file your map needs. After I added my Rio Grande shapefile to my data frame, I added the County and PanEvap data from Learn and my base map and ended up with the below.
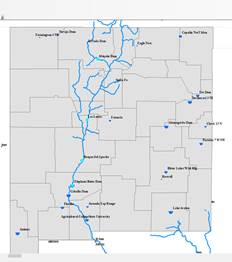
Once my layers were properly labeled I started playing around with the attribute table associated with the pan evaporation, also on the map I noticed that there were a few sample locations located along the Rio Grande that could help show if there is a gradient difference between upper, mid, and lower Rio Grande pan evaporation. In the attribute table I selected the locations I wanted to compare; in this instance it was Abiquiu Dam, Los Lunas, Bosque del Apache, and Elephant Butte Dam (two sample sites are dams and the other two are diversion areas). I changed the labels for the selected attribute table so that it was easier to see when selecting specific lines. When specific information is selected in the attribute table it highlights the spot on the map (you can change color or symbol later in the properties tab).
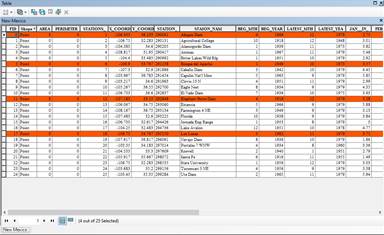
Interestingly enough the sampling locations I chose along the Rio Grande did not differ much in their annual pan evaporation like I believed they would. Originally I believed that the dams would both have a higher annual pan evaporation due to their surface area and the fact that they just hold the water without major surface flow. I left the decimal points in the table because I wanted to help show the difference between the amounts; especially between Abiquiu Dam (82.97 in) and Los Lunas (80.56 in). One hypothesis that I could accept was that I believed that, of those selected, Elephant Butte Dam would have the largest annual pan evaporation loss.
After playing around with the colors and data I ended up with the map below.