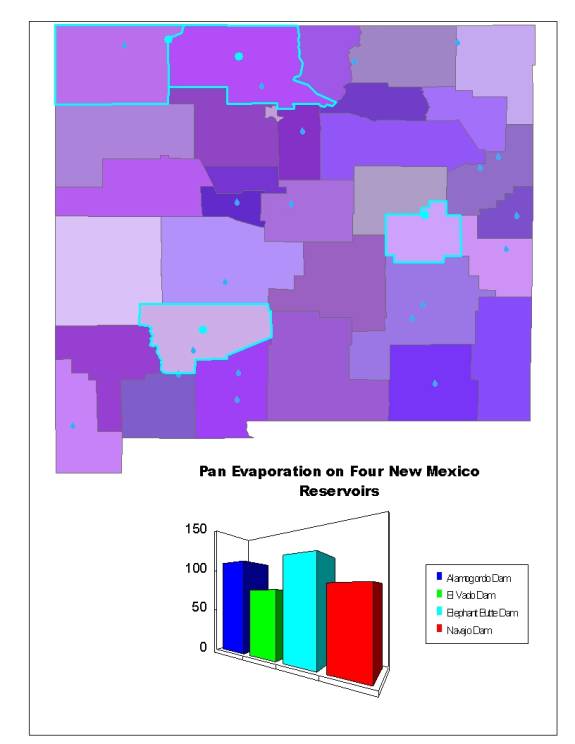
This New Mexico map is
divided into counties and catagorized by area and population. The raindrops represent the study areas for
pan evaporation. The highlighted
raindrops are for 4 various reservoirs and their evaporation loss is expressed
in the graph.