
Currently Being Prepared!


Background
I will be preparing several examples to illustrate some commonly used spatial analysis techniques. Most of these examples will use publicly available data such as health, crime, and demographic statistics available from sources such as ArcGIS Online, the NM Resource Geographic Information System (RGIS), the NM Community Data Collaborative (NMCDC), the New Mexico's Indicator-Based Information System (NM-IBIS), the City of Albuquerque (ABQ Data), Bernalillo County (Public Works), and the Mid-Region Council of Governments (Maps & Data) for New Mexico at the census tract, block group, and block levels of geography. Most of these data are aggregated (polygon based) and some are individual events (point based). All these applications will use ESRI's ArcGIS and some will use ArcGIS Pro or QGIS. Additional analyses will be performed using GeoDa, PySAL, and CrimeStat to provide more detailed descriptions of the results. The 2010 Census (population data and geography) provides the foundation for these examples. In addition, more current data estimates available from the American Community Survey (ACS) that have been prepared in Geodatabase Format have also been used (also see the Census Business Builder and Social Explorer for census data). When census data were unavailable, updated demographic data estimates were obtained from UNM's GPS and also Esri Demographics - Updated Demographics using ArcGIS Online Data Enrichment or the ArcGIS Pro Enrich Layer Tool. These data are also available from Esri's Living Atlas of the World. Esri has also been encouraging government agencies to participate in their Open Data program which hopefully may result in more New Mexico data becoming available for public use in the future.
Note: An ArcGIS Online Web Map Application - NM 2015 Census Tract Population Estimates that compares ESRI and GPS estimates has been prepared for researchers that use both data sources. They are very similar (Pearson's correlation 0.9921849) with the ESRI population total of 2,105,287 persons and the GPS population total of 2,099,848 persons. Additional Note: The GPS total of 2,099,848 was derived from the Excel census tract file downloaded from IBIS on 9/1/2016. Since then GPS has released 2015 population estimates in geodatabase format (downloaded on 11/10/2016) and the census tract total is 2,099.852 persons. Both are slightly different than the county total of 2,099,856 persons.
There are many good sources that explain spatial analysis techniques with examples. I have found that esri's Spatial Statistics Resources web page has been very useful. Also learning statistical and programming software such as SAS, R, and Python have been essential skills. Python scripting is fully integrated in esri's ArcGIS (ArcPy) and also in QGIS (PyQGIS). As both ArcGIS (R-ArcGIS) and QGIS (Configuring external applications - Creating R scripts) have developed improved interfaces for R, now is a good time to do some more development with this widely used open source statistical software.
In general, spatial statistical methods are concerned primarily with two basic questions; where and why? The process of analyzing spatial distributions usually begins with describing the pattern and investigating if the pattern exhibits spatial autocorrelation. The pattern can be random (null hypothesis), clustered, or dispersed. There are global and local statistics that can be used for this initial investigation. Global statistics (such as Global Moran's I and Getis-Ord General G) are used to detect and measure if a non-random (clustered) pattern exists. They calculate an average value for all observations in an entire geographic area under study. Local statistics (such as Getis-Ord Gi*) focus on the pattern or where the clusters are located. They calculate a unique value for each obsertvation in a geographic area under study.
If the pattern is not random, further investigation usually employing linear regression methods focuses on the identification of the processes and relationships that resulted in the spatial pattern. There are both global and local methods of linear regression. Ordinary Least Squares (OLS) is a routinely used and well-developed global method. There are several more recently developed local spatial regression methods such as Geographically Weighted Regression (GWR) that are more suited to geographic or spatial data.
There are many specially developed mathematical techniques for analyzing spatial data and the choice of the appropriate method given the characteristics of the data is usually a challenging part of any analysis. The following examples will briefly explain why any given method was used and also how to interpret the results. It is also a very good exercise for me to gain a better understanding of these methods, and it will take some time to fill out this page!
Example of Some Current Results (ArcGIS Online Web Map)
(see Web Mapping Applications below for a better display)
Albuquerque & Bernalillo County Data
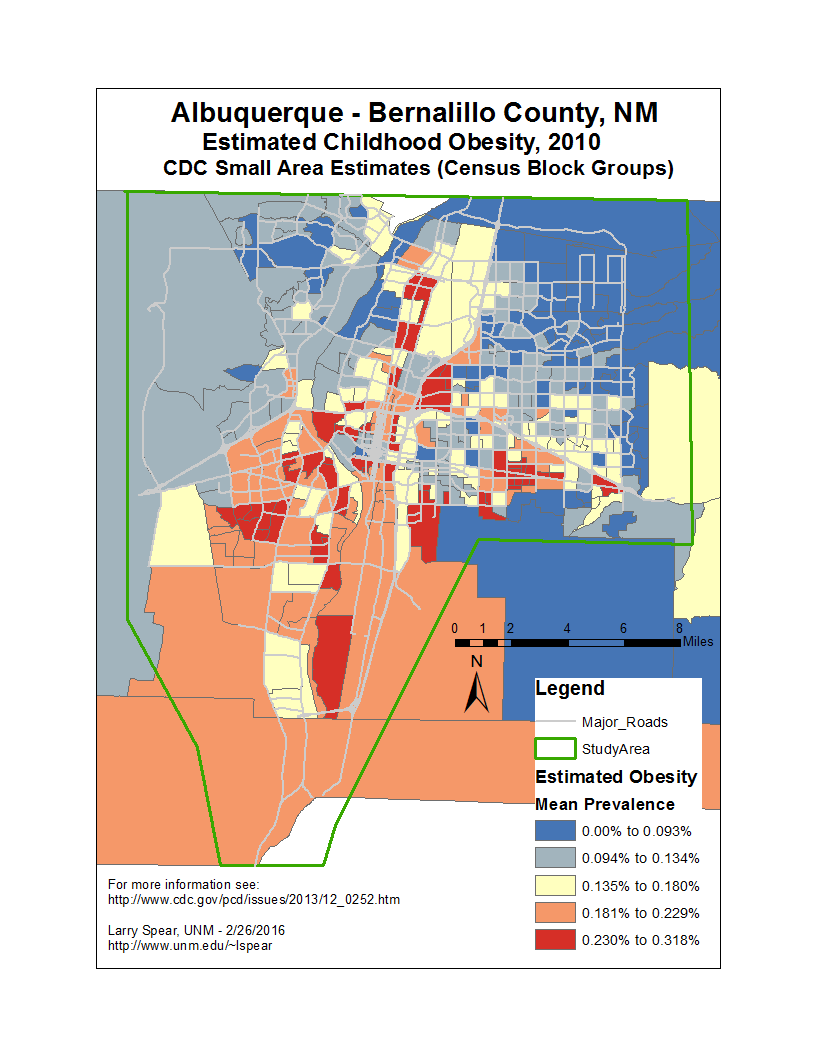
Childhood Obesity, 2010
You can click on the map to the left to see the distribution as estimated by the CDC. These data were obtained from the NMCDC. I used two global statistics; Global Moran's I to measure spatial autocorrelation, and Getis-Ord General G to see if the pattern of childhood obesity exhibts spatial clustering of high or low mean values. The ArcGIS Global Moran's I results show that there is significant spatial autocorrelation (p < 0.001) as do the R and GeoDa results. The ArcGIS Getis-Ord G results and the R Getis-Ord G results show a high degree of clustering in certain locations within the greater Albuquerque, NM area. There is a high level of confidence (p < 0.001) that the clustered pattern of relatively high values of obesity is not due to a random process. In addition, a local statistic, Getis-Ord Gi* (ArcGIS Optimized Hot Spot Analysis) was performed to calculate and map statistically signigicant hot and cold spots( see results map). These areas exhibit a more noticeable health related problem that should be targeted for various intervention methods to help reduce the prevalence of childhood obesity. However, as the data are estimates derived from "the influence of demographic characteristics" the why question for the high values is addressed by the multilevel model that was used. For this example, it is not necessary to use additional spatial statistics to investigate the relationship between the prevalence of childhood obesity and the influence of certain demographic factors (race/ethnicity, poverty, etc.). Note: An ArcGIS Online Web Map Viewer or ArcGIS Online Web Map Application are also available.
Albuquerque Home Burglaries, 2015 and 2016 (Preliminary Work - See Albuquerque Crime Data, 2016)
Note: Data depicts the date the burglary incident was reported and might be diffrent from the date
the incident took place. Location is the neighborhood block level.
The map on the left depicts the distribution of residential burglaries in Albuquerque during the last two months of 2015. This is only a preliminary examination of this data using the ArcGIS Pro - Optimized Hot Spot Analysis tool. More work is being undertaken to illustrate how other software and spatial analysis methods can be used to better understand this distribution over a longer time span.
The Albuquerque Police Department (APD) makes crime incident data available from the City of Albuquerque (ABQ Data) web page. There is also an interactive map of recent crimes available from their Crime Mapping web page. Recently, APD has conducted a mayor's initiative study and prepared a series of widely focused (by ZIP Codes) summary statistics and maps to better inform the public (see www.cabq.gov/crimeprofiles). In addition, an ArcGIS Online Web Map Viewer has been prepared by the NMCDC and a Google Web Map (Albuquerque Crime) has been developed by the Albuquerque Journal , both with currently available crime data from the Albuquerque Police Department (APD). However, more in depth spatial analyses of these data that will identify hot spots and long term trends is not available from these other researchers. I am not aware if APD has conducted any more in-depth studies, but currently there are no results available to the public. I will use the CrimeStat software package, ESRI's ArcGIS, and ArcGIS Pro to conduct these types of analyses and make the results available. Note:It will take some time to develop and test this application using the limited data currently available for download (only the previous six months). A more complete calendar year data set for 2015 will eventuall be requested from APD. Final results will be available as an ArcGIS Online Story Map.
As part of the preliminary examination of these data I will be preparing a series of test maps that illustrate several well developed methods used by other researchers. They will be prepared using both CrimeStat and ArcGIS. A basic kernel density technique was applied first (see ArcMap from CrimeStat Kernel Density and ArcMap from ArcGIS Desktop Kernel Density). The results were similar (almost exact) for both methods. The next map (see ArcMap from CrimeStat Dual Kernel Density) was produced using a weighted kernel density that was normalized by the estimated amount of households in each census block group during calendar year 2015. This Dual Kernel Density method available in CrimeStat and not in ArcGIS (can't be calculated directly) is a useful way to calculate the relative risk of burglaries at various locations. The 2015 population and household estimates were obtained from Esri Demographics using ArcGIS Online Data Enrichment. Note: An ArcGIS Online Web Map Viewer - Burglary Risk 2015 Q4 is also available.
Previously: I have requested the calendar year 2015 burglary data from APD (requested mid June 2016) but as yet have not got a response. The CrimeStat Dual Kernel Density method has been redone using a combination of 2015 (n=813) and 2016 (n=2338) burglary (10/30/2015 to 7/7/2016) data within the study area (most of metropolitan Albuquerque). I reused the 2015 household data for the normalization and this should still produce acceptable results until 2016 household data becomes available See the updated ArcMap PDFs ( Risk Levels and Statistical Distribution). Note: An ArcGIS Online Web Map Viewer - Burglary Risk 2015 and 2016 is also available. ** I recently (January 2017) got very helpful assistance with 2016 data and may eventually request all the 2015 data again.
New: I have performed further analyses based on a recent ESRI demonstration presented at the 2016 Annual Users Conference and available on GeoNet (see R-ArcGIS Bridge Workflow Demo). The analyses used burglary data for November, 2015 through August, 2016 (10 month period). It was conducted in ArcGIS Pro using several of the tools in the Space Time Pattern Mining Toolbox and the R spdep package. A map of statistically significant high and low burglary rates can be produced for the entire study area (see ArcGIS Online Web Map Viewer - Albuquerque, NM Optimized Burglary Hot Spots). These results show that there are some locations with unusually high rates of burglaries over this ten month span (see ArcGIS Online Web Map Viewer - Albuquerque, NM High EB_Rate Burglary Locations). There are several areas of emerging hot and cold spots with the majority of Albuquerque with no discernable trends or changes (see ArcGIS Online Web Map Viewer - Albuquerque, NM Burglary Emerging Hot Spots). An ArcGIS Online Web Map Viewer that combines several of the above Web Map Viewer layers is also available (see Albuquerque, New Mexico - Burglaries (2015 - 2016)). Plus an ArcGIS Online Web Mapping Application has also been prepared (see Albuquerque, New Mexico - Burglaries (November, 2015 - August, 2016). These results will be updated in the future as more data from APD is obtained. The updated results will include an interactive map prepared with the Web App Builder for ArcGIS and some additional analyses as described in the recent Esri Training Seminar Space-Time Pattern Mining: A New Frontier in Spatial Analysis.
Albuquerque Crime Data, 2016
Note: Data depicts the date the crime incident was reported and might be diffrent from the date
the incident took place. Location is the neighborhood block level.
I will be expanding the analyses of crime data beyond burglaries that was my initial focus as these data provide an excellent and available source to test and demonstrate several widely used spatial analysis methods. Crime data for 2016 (January - December) has been prepared and more analyses for several crime categories is being conducted (see maps listed below). I will continue to use the ArcGIS Pro Space Time Pattern Mining Toolbox (see Analyze Crime Using Statistics and the R-ArcGIS Bridge, 2017). Also, some additional analyses will be conducted using the R cluster detection library as several of these methodologies are not currently implemented in ESRI's ArcGIS. These results will be presented using ArcGIS Online. A web map with preliminary results has been prepared (see Albuquerque, NM Crime Density 2016). Note: Click content tab to view more crime categories such as Auto Theft. Update: The Web Mapping Applications (below) contain multiple layers (Density, Optimized Hot Spots, Emerging Hot Spots, and EB_Rates) for selected crime catagories. More of these are being prepared and they will be available soon. A web mapping application depicting the relative risk for crimes will eventually be prepared using the CrimeStat software package. Also, 2017 crime data is currently being collected and multiple year maps (combined 2016 and 2017 data) will be prepared in the future. Additional: There are other good sources for more up-to-date map based Albuquerque crime data (see Additional Albuquerque Crime Maps below). My goals are to illustrate more analytical and reliable statistical based methods for the identification of problem crime locations. This requires more than just six months (180 days) of data and more effort to prepare the data, employ various methods, and present comparisons of the results.
2016 Albuquerque Crime Maps (Emerging Hot Spots):
- Crime Hot Spots
- Auto Theft Hot Spots
- Auto Burglary Hot Spots
- Residential Burglary Hot Spots
- Commercial Burglary Hot Spots
- Vandalism Hot Spots
2016 Albuquerque Crimes (Web Mapping Applications):
Additional Albuquerque Crime Maps (Some other sources):
![]() Albuquerque Crime Data, 2017 and 2018 (Currently Being Prepared!)
Albuquerque Crime Data, 2017 and 2018 (Currently Being Prepared!)
I have just started work again on this project although another research project is still taking most of my efforts. I have been using the SAS University Edition and the R-ArcGIS Bridge to piece together and clean up separate JSON files (180 day snapshots?) that I downloaded monthly during 2017 and early 2018. As APD has yet to make available complete calendar year data for download this is the most accurate data I have access to. There has also been some great work done by Esri in this area. I will be using the Operations Dashboard for ArcGIS (See Introduction and Recent Developments) to display these data and results of additional statistical analyses. NOTE: There seems to be problems (files too small and incomplete) downloading the 2018 data. I have requested information about this problem, but have not yet received a reply. Perhaps this very useful open data community resource is currently undergoing upgrades in light of a recent NM Legislative Finance Committee report that recommended using more analytical tools in the future. Update: As of late January 2019 the previous problem with downloading json files seems to have been fixed. I will be returning to work on this project as I can fit it in between work on other projects. I am also currently learning more about Geographic Artificial Intelligence ( GeoAI) and hope to expand this research to use some of these methods in the future ( see AI-ML Class Project, YouTube).
2017 Albuquerque Crime Maps (Emerging Hot Spots):
2017 Albuquerque Crimes (Web Mapping Applications):
![]() Albuquerque Crime Data, Recent Five Years, 2016 to 2020 (Currently Planned!)
Albuquerque Crime Data, Recent Five Years, 2016 to 2020 (Currently Planned!)
Based on preliminary work (see above) using the 2016 to 2017 Albuquerque crime data that was downloaded at various times intervals and only in 180 day snapshots, I plan to demonstrate some of the recent methods available in ArcGIS Pro (see Crime Analysis Solution) and the research of others (see UCL Institute). I also hope to demonstrate the use of Geographic Artificial Intelligence ( GeoAI) for Albuquerque crime data analysis. Once this preliminary work is completed, I hope to acquire a more complete five year (2016 to 2020) crime dataset from the City of Albuquerqe CABQ Open Data Portal and the Albuquerque Police Department (APD). Hopefully more extensive crime datasets (beyond recent 180 day snapshots) will eventually be made available similar to what other cities like Baltimore Open Data and Philadelphia Open Data are providing. This good government initiative makes these data more accessible for students and other researchers to use and promotes public participation. I don't know if a complete five year (2016 - 2020) dataset useful for more in-depth analysis is currently planned for Albuquerque. Obtaining this dataset even if available may require a special request. Note: Esri's law enforcement team is currently preparing new videos and blogs to highlight recent developments and capabilities (see Automating RMS/CAD data import with Crime Analysis Solution.

Albuquerque Food Stores, 2013
See the Albuquerque food retail locations page for another example of block group related spatial analysis. Note: An ArcGIS Online Web Map Viewer or ArcGIS Online Web Map Application are also available.
New Mexico Data
New Mexico Health Insurance Coverage, 2009-2013
These are average estimates over a five year period.
You can click on the map to the left to see the distribution as estimated by the census. These data were obtained from the NMCDC(Census ACS, 2013), and NMCDC(Census ACS, 2013). I will investigate this distribution using exploratory regression (data mining) to see if there is a relationship to the distribution of other socio-economic data also available from the census. Exploratory regression will also check for spatial autocorrelation and perform other diagnostics used with Ordinary Least Squares (OLS) regression. If there is strong evidence of nonstationarity (regional variation), then Geographically Weighted Regression (GWR) will be employed.
The ArcGIS results are promising (Adjusted R2 = 0.64, p-values < 0.001, AICc = 3221.35, small VIFs) for the selected model from ArcGIS exploratory and OLS regression. Small improvements (Adjusted R2 = 0.686 and lower AICc = 3174.56) were apparent using ArcGIS GWR. However, a slightly different model (another possibility from ArcGIS exploratory regression) is being tested using GeoDa-GWR and R-GWmodel because ArcGIS GWR could not compute this model (slightly higher VIF=17.46, global multicollinearity). These results do show a little improvement (Adjusted R2=0.7179 and AICc=3127.20) regardless of the explanatory variable redundancy (VIF > 7.5) due to the addition of one more variable. This example has been a useful comparative exercise to show that GWR can provide a model that better fits the data than OLS. However, the model parameters for GWR are more complicated than for OLS. The choice of an appropriate kernel type and bandwidth should be based on practical experience or justified by established theory. More research is necessary to better calibrate a GWR model to fit the data for this application. QGIS was used here only to produce maps of these results (Std. Residuals and Local R2). Note: An ArcGIS Online Web Map Viewer and ArcGIS Online Web Map Application are also available.
Note: This data contains estimates of the American Indian population that have some access to healthcare provided by the Indian Health Service (IHS). However, people with no coverage other than access to IHS services are still considered uninsured. Beginning in 2014, given the provisions of the Affordable Care Act, everyone is required to maintain "minimum essential coverage", and being eligible for IHS services does not meet this requirement. These data are for 2009-2013 and it is expected that different results will be obtained after the 2014 and later data are available. However, I hope it will still provide a good example of the methodologies that can be applied.

New Mexico Family Practice Physicians, 2013
See the NM healthcare providers and facilities page for another example of census tract related spatial analysis. Note: An ArcGIS Online Web Map Viewer or ArcGIS Online Web Map Application are also available.
![]() New Mexico Census and Demographic (Web Based) Data (Currently Being Prepared!)
New Mexico Census and Demographic (Web Based) Data (Currently Being Prepared!)
When previously employed at UNM's Division of Government Research (DGR) I had made seleceted New Mexico census and demographic data available in interactive web format for viewing and download for many years (see NM Traffic Crash Plus Census and Demographic Data). Since then, there have been many technical improvements and new innovations that can enhance useability and data delivery (see ArcGIS Online Data Enrichment and Esri's Business Analyst). Several UNM and State agencies have developed great web pages for this data (see below). However, most have not yet employed some of these latest developments. I plan on illustrating some of these methods to hopefully demonstrate their utility and encourage the public application of Open Data. For instance, interactive data exploration can be facilitated using the ArcGIS API for JavaScript and Smart Mapping (see Building a Web App for Data Exploration with Smart Mapping and You Tube). Note: A separate web page for both traffic crash data and demographic data will eventually be prepared.
Additional Helpful Sources for Spatial Statistics:
- Geospatial Analysis - Online
- Spatial Analysis - Wikipedia
- GIS Collective
- National Center for Geographical Information and Analysis
- Center for Geographical Information Science
- GeoDa Center for Geospatial Analysis
- Inside-R
- R-Spatial Project
- Global Measures of Spatial Autocorrelation (PowerPoint)
- Local Measures of Spatial Autocorrelation (PowerPoint)
Some Sources for NM Census and Demographic Data:
- UNM's Bureau of Business and Economic Research - BBER
- UNM's Geospatial and Population Studies - GPS
- NM Resource Geographic Information System - RGIS
- NM Community Data Collaborative - NMCDC
- New Mexico's Indicator-Based Information System - NM IBIS
- City of Albuquerque (ABQ Data)
- Bernalillo County (Public Works)
- Mid-Region Council of Governments (Maps & Data)
- Also:
- 2010 Census
- Census Population Data
- American Community Survey (ACS)
- Census Geography
- Esri Demographics
Some Crime Mapping GIS and Spatial Analysis Resources
- Crime Mapping - Wikipedia
- Urban Crime Mapping and Analysis Using GIS (ISPRS Special Issue)
- Esri - Getting Started with Crime Analysis
- ArcGIS Pro Crime Analysis Tools
- Crime Analysis and Crime Mapping Information Clearinghouse
- From Crime Mapping to Crime Forecasting (NIJ Journal)
- GIS and Crime Mapping (UCL)
- Esri Analytics, Analyzing violent crime
Address and Contact Information
     Larry Spear, Sr. Research Scientist (Ret.)
     Division of Government Research
     University of New Mexico

     Email: lspear@unm.edu  lspearnm@gmail.com
     WWW: https://www.unm.edu/~lspear
     LinkedIn https://www.linkedin.com/in/larry-spear-93371970
 UNM's Home Page
This page has been accessed 20787 times since 8/18/2012.
You are the 20788th person to access this page.
Last Revised: 8/25/2021 Larry Spear (lspear@unm.edu)