Na Lu HOME
Homework 2
![]()
|
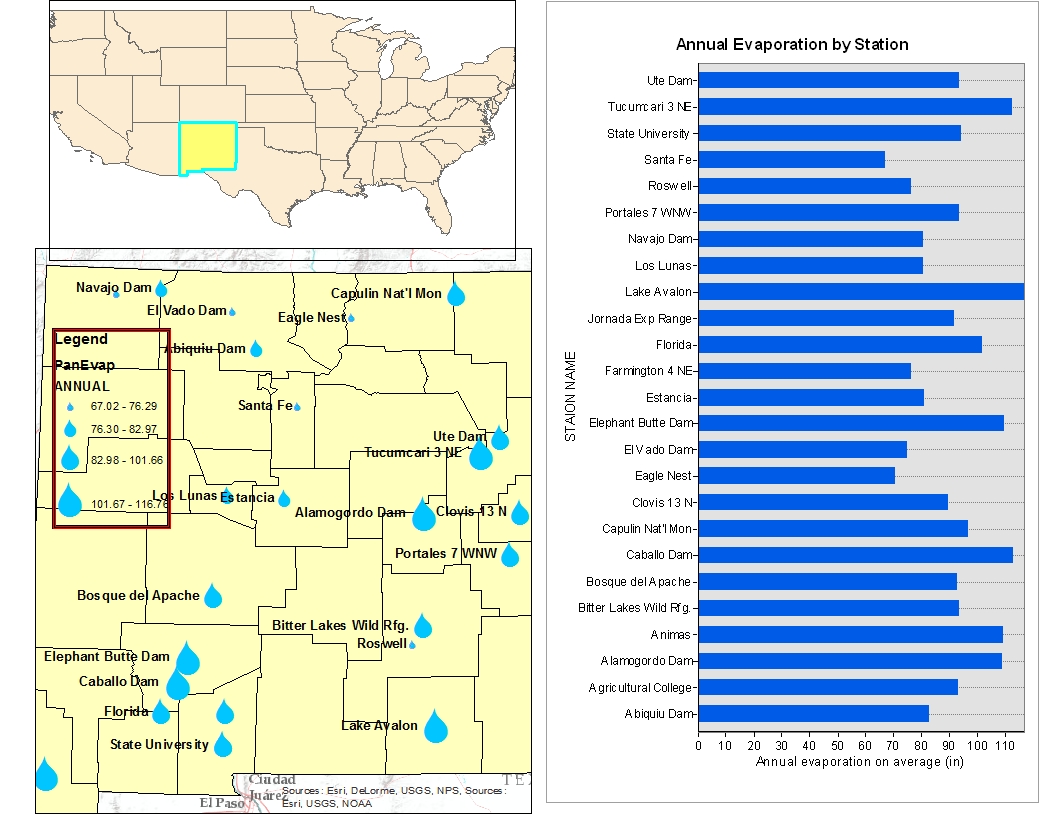
In this homework, I post 2 maps and 1 graph in
one layout. The map on the up-left corner shower the location of New Mexico
in the United State. The map on the low-left shows the average annual
evaporation by different stations in New Mexico. The legend is blue water
drop which the size indicate different level of evaporation. I also create a
graph that shows that average annual evaporation of different stations in New
Mexico. From the graph, we can easily tell that Lake Avalon has the highest
evaporation , while Santa Fe has the lowest level of evaporation. |
|
|
Evaporation
in New Mexico |
|