Use of Landsat Images for comparing well’s
depth
with biomass (greenness) in
Lincoln National Forest (New Mexico)
Introduction
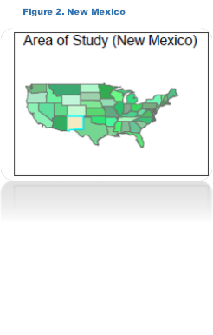
Landsat images can be
analyzed with ArcMap to understand greenness abundance from the space. Lincoln
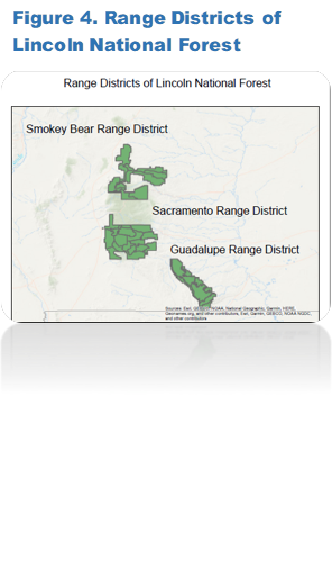
National Forest is one of the greenest areas in New Mexico, possibly for its
highest elevations range (from 4,000 feet (1,200 m) to 11,500 feet (3,500 m))
(1), and it has 1099 groundwater wells in the area of study (2) which can be
affecting its biomass abundance. Hence, the objective of this project was to
know if there is a direct relationship between biomass (“greenness”) and
groundwater well´s depth in Smokey Bear and Sacramento Range Districts at
Lincoln National Forest (New Mexico) using the Normalized Difference Vegetation
Index (NDVI).
Data
Analysis
·
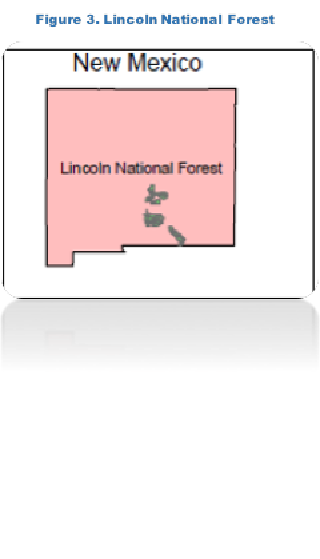
Shapefiles
(NM polygon, NM River lines, Lincoln-Otero counties groundwater well points,
Lincoln National Forest polygons) were used to have the two different study
areas separated: 1. Smokey Bear District Range – with Lincoln County
groundwater wells 2 (Fig. 4) Sacramento District Range – with Otero County
groundwater wells (clip, export data, select by attributes tools were used).
·
The
groundwater well´s depth data was obtained in .txt file that was modified (in
Excel) for having the information tab separated, therefore, making it available
to add it as a table in ArcMap.
·
The
well´s depth was joined to the attribute table of the Lincoln-Otero counties
groundwater well points to know what was the depth in the two different areas
of study.
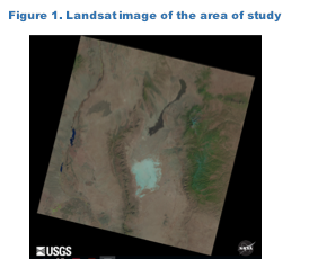
·
11
band raster images were downloaded from the EarthExplorer
website. I used Image Analysis in ArcMap and under this, I chose band 4 and 5,
and run the NDVI function in ArcMap. As the values range are from 0-200, using
the classification symbology of the layer properties,
I could see the statistics of these values and interpret the results.
Results
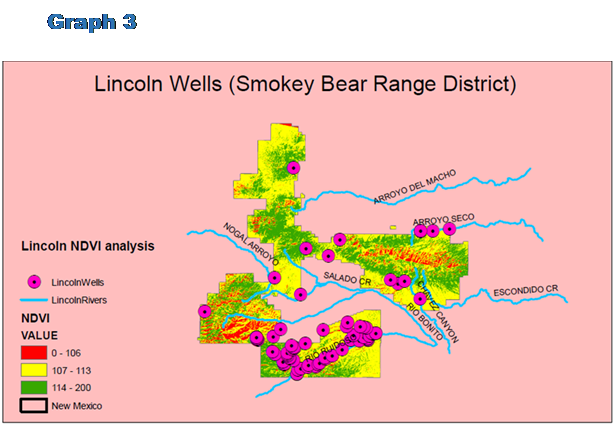
1.
Putting the New Mexico
Rivers Layer, the Lincoln Forest Layer, and the groundwater wells from Lincoln
and Otero Counties, it was very easy to see that the wells were located very
close to the rivers, so the water which comes in is from the rivers and not
from the forest itself.
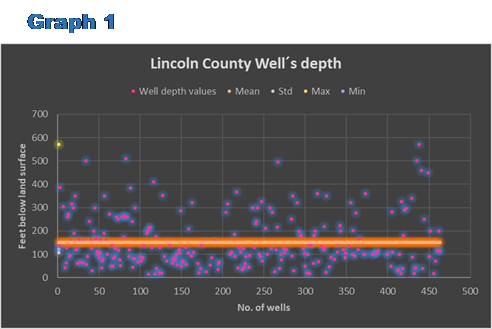
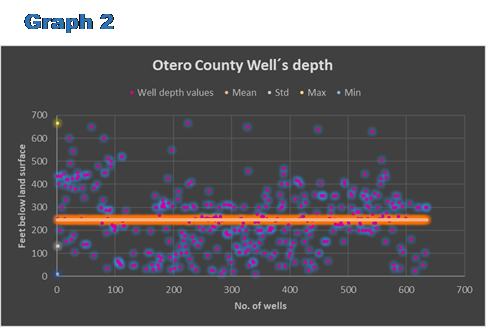
2.
Doing the statistical
analysis and getting the average feet under the land surface from the well´s
depths on Lincoln County Wells, it shows 151.15 (Graph No. 1). On the other
hand, Otero County Wells present an average of 246.48 feet under the land
surface. Both averages are normal under the Lincoln Forest parameters but are
slightly different.
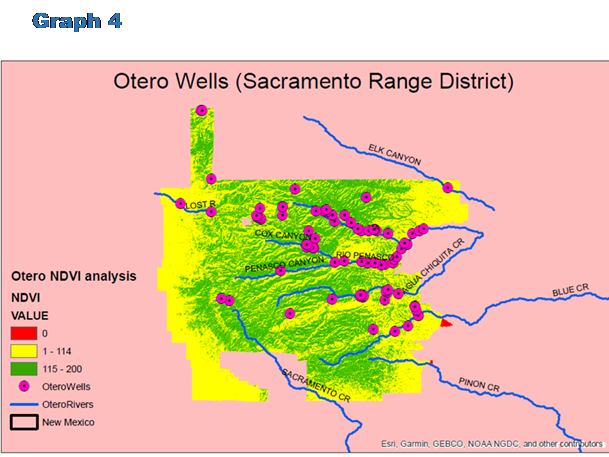
3.
Applying the NDVI
function, under Image analysis, and changing the symbology,
under the manual classification, and using three main classifications, three
values of “greenness” intensity were found. For Lincoln County and the Smokey
Bear District Range, from 1-106 there´s almost none greenness, from 107 to 113
there is a medium greenness and finally from 114 to 200 we can see the
greenness abundance in the area (Graph No. 3). For Otero County and Sacramento
District Range, the lowest parameter of greenness presents a 0 value, from
1-114 there is a medium greenness and finally from 115 to 200 we can see the
greenness abundance in the area (Graph No. 4). This leads to the conclusion
that there is not direct relation between the greenness and the groundwater´s
well depth, and more data analysis should be done in order to get to a strong
conclusion.
References
1.
Berry,
J. K. (1993). Beyond Mapping: Concepts, Algorithms and Issues in GIS. Fort
Collins, CO: GIS World.
2.
EarthExplorer. (n.d.). Retrieved May
4, 2018, from https://earthexplorer.usgs.gov/
3.
United
States Department of Agriculture. (n.d.). Lincoln
National Forest - Home. Retrieved May 4, 2018, from
https://www.fs.usda.gov/lincoln
4.
USGS
Groundwater Data for New Mexico. (n.d.). Retrieved
May 4, 2018, from https://nwis.waterdata.usgs.gov/nm/nwis/gw