Homework Description
1. First I downloaded the data from the UNM Blackboard
2. I went to ArcCatalog and look for Import Coverage, I found the tool that is called Import from E00 and I converted the 3 files.
3. I added the Spatial Analyst extension took from the Tab: Customize, Extensions and I checked the Spatial Analyst.
4. Then I went to my ArcToolBox and I started looking for Data management tools, where I found Raster, Raster Dataset and Mosaic.
5. I joined together the three imports of the coverages into my “target raster” which was the first one: e17170
6. Later one I started playing with the symbology of the layer properties. And I used the Stretched (3754 to 1480 colors band)
7. Then I went to the my ArcToolbox and I started looking under my Spatial Analyst tool the one that says Hydrology and under this the Fill tool.
So the input was my e17170 and I got a fill layer.
8. I also tried the Raster Calculator Method, but I preferred to use the toolbox, because for me it is easier just to drag the layers that I need to use
and click ok, rather than writing the whole formula. It takes much time and there is a possibility that you can make mistakes and the tool will not work.
9. Later one I went back to Hydrology tools, and I used the Flow Direction tool, I put my fill layer and I got a new map with the direction of the flow.
10. Later on, going to the same Hydrogeology folder, I found the flow accumulation tool, and I just dragged my flow direction layer.
11. Using again my Hydrology tools, in order to make my raster into polylines, I found the one that says Stream to feature and I clicked ok.
12. Using again my Spatial analyst tool, and Hydrology, I found the Stream link tool, and as an input, I used my streams layer.
13. In order to define outlets, I tried the Raster calculator, but I found it again easier to use the toolbox, where I found the ZonalStatistics and selected the
specifications that I needed in order to get the maximum value of my streams link layer and the flow accumulation layer.
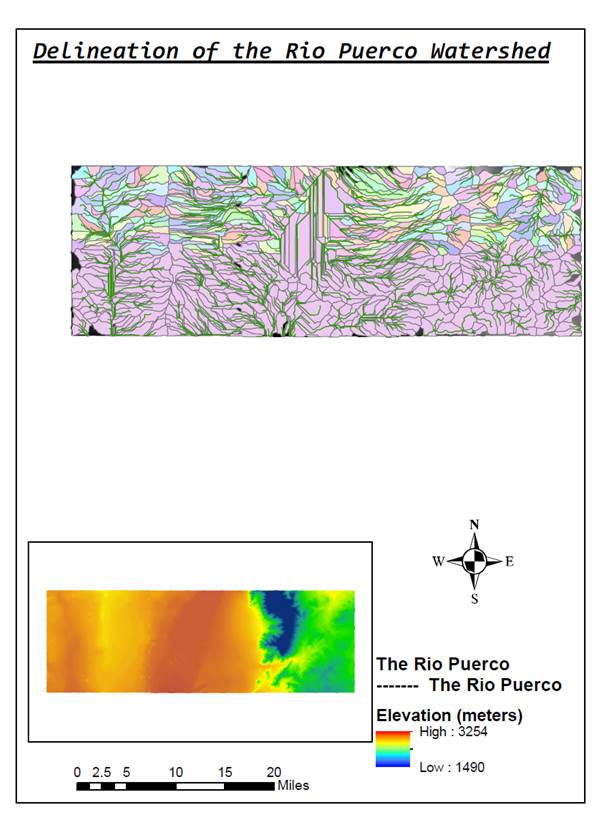
14. Later on, I used the watershed tool from my arctoolbox and as input I took my flow direction layer and the zonalstatistics (with its maximum values)
and I clicked ok, to get my layer (watershed) delineated.
15. I went to the layer properties and started changing the colors of the stretched symbology that we can find there.
16. Finally, I went again to my arctoolbox, I looked for Conversion tools, Raster, and took Rater to polygon, to get a polygon from my raster and all
the layers that I made.