HOMEWORK NO. 5
ISABEL
MEZA
Homework description:
·
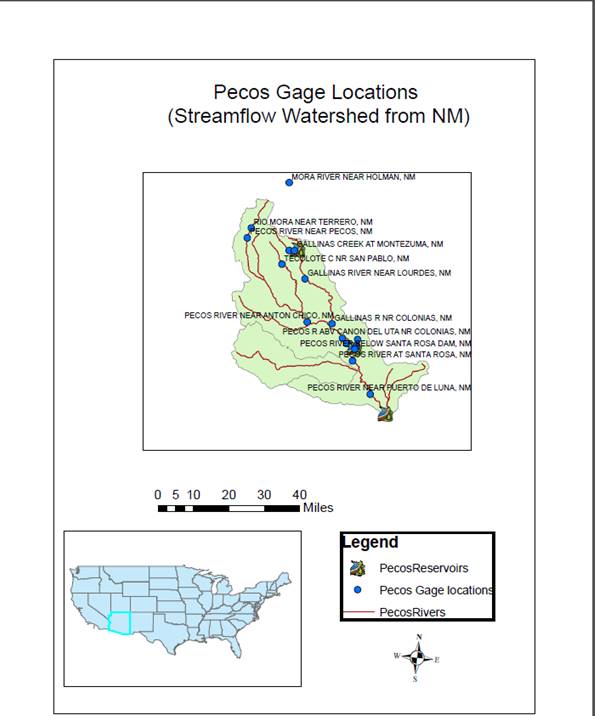
First I downloaded the datasets required for
this homework, that were in Assignment No. 5. There were 3 layers, and I added
the layer that said HUC250K.
·
Going to the layer’s properties, and under the
tab of Definition Query, I formatted the query with the following: “Reg”=”13”,
which belongs to the Rio Grande basin.
·
I changed the symbology
and I added the other layers: Streams and Reservoirs
·
Later on, I changed the symbols of the
reservoirs.
·
Then, I went to the Selection By Attributes in
the Huc250k layer, looked for the “reg” value and use the
query to select the “CAT”=’13060001’ which selects the headwaters of the Rio
Pecos.
·
After selecting Rio Pecos region, then I played
with the select by location bottom, which is under the select by attribute.
Following the instructions I went back and I selected the “reg”
with both numbers: “CAT”= ‘13060001’ and ‘13060002’
and the region selected became larger.
·
With the selection tool found in the main bar, I
selected the whole stream network which is inside the Pecos River area and
exported it.
·
Later on, I went to the website described in the
instructions and downloaded the information required. In this point I thought I
had all the information, but when I was adding the XY data I struggled a lot,
because the altitude number was not showing and I couldn’t select as my Z axis.
Asifur gave me the right XLS files, otherwise, I
wouldn’t have been able to finish this homework.
·
After I got the right data, erased the unnecessary
information I converted to a 1997-2003 Excel File.
·
To add the files, I went to File tab, and added
the XY Data, using all the information for the X, Y and Z coordinate system.
·
I also went to edit to change the coordinate
system the NAD 1983 and clicked apply and Ok.
·
After I imported the information, I had a new
layer and then I just labeled the features.
·
Later on, I exported the data, and created a
layout of the Pecos Headwaters.
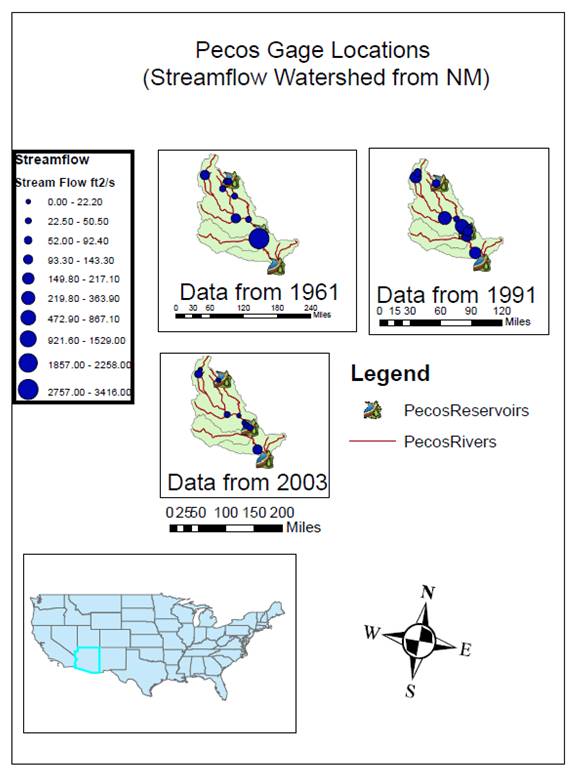
For the second layer out, using the PecosData
I did the following:
·
I opened my geodatabase where I am doing this
Homework No. 5, right clicked, import, and selected table (single).
·
Later on, with the new table added, I selected
Join, after the right click over the layer, and I filled the name of the field
which is going to be used to join the information, in this case, site_no. I also selected the table layer where I wanted the
results to be, so I selected my Pecos Gage Sites and clicked OK.
·
After that, I also selected the Display XY data, and
I set the information that was used before for the spatial data: “latitude”,
“longitude” and “altitude” for the X, Y, and Z coordinates, but this time is
going to display as the Pecos Gage Sites name.
·
I exported it and added a new layer named Pecos HWDIscharge in my map.
·
I changed the time information, which is found
in the TIME tab of the layer properties, and I selected the field where years
are shown. I selected the time extent from 1997 to 2014.
·
I also changed the symbology
to Graduated symbols, 10 classes and modify the number of decimals presented.
·
I used the time slider to play with years and
the information required, and created the temporal data layout.