I
have learnt how to open a map with different attributes by doing this exercise.
Figure 1 shows the world population with cities, ocean and, longitude and
latitude.

Figure
1: World population with cities, ocean and, longitude and latitude.
Figure
2 shows the air pollution by countries. The red color indicates the worst
pollution and green color shows the least pollution.
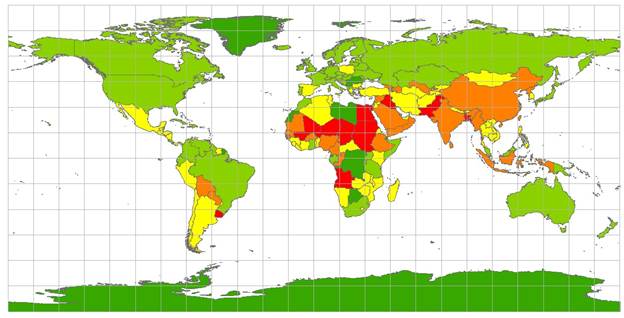
Figure 2: Air pollution by countries.
Exercise 3b: Navigating a Map
In this example we have learnt how to use zoom pan,
identify a country and various information on a
particular country including ISO
number and population.
Figure 3 shows
information on country India as
the Identify tool was used to find out information on this particular country.
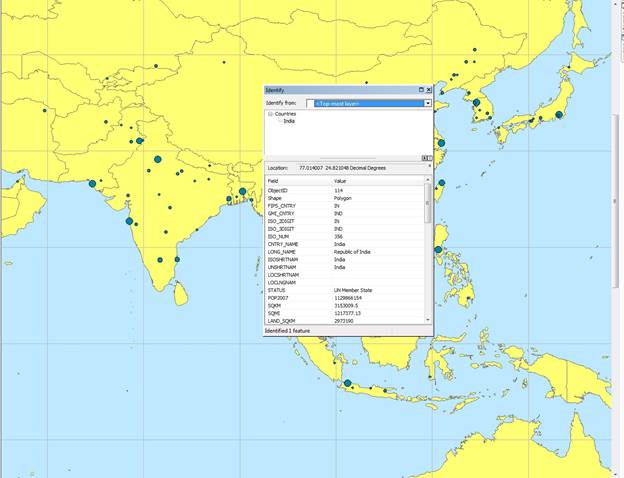
Figure 3: Identifying features by navigating a map in
ArcMap.
Exercise 3c: Using Basic Tools
We have learnt about some basic tools of ArcMap and
their function. Figure 4 shows the function of viewer window. This tool is used
to view a map in a different window with a magnifying view.
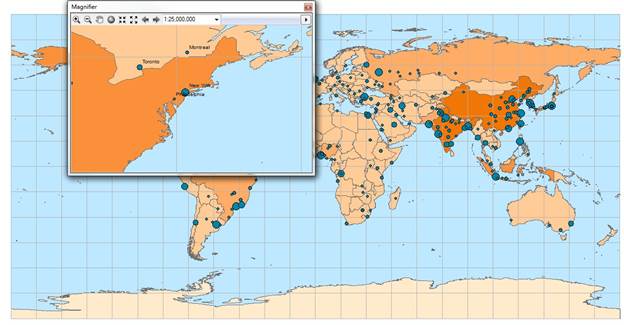
Figure
4: The function of a viewer window
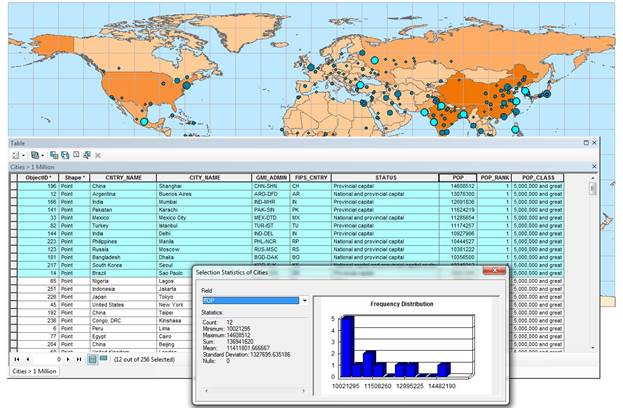
Exercise 3d: Looking at feature attributes
In this exercise, we have learnt how to find out the
information by looking at the feature attributes of a map. Figure 5 shows the
table attributes of cities. We can organize the data either descending or ascending order.
The statistics window
shows the frequency
distribution of twelve
most populated cities.