Assignment
2:
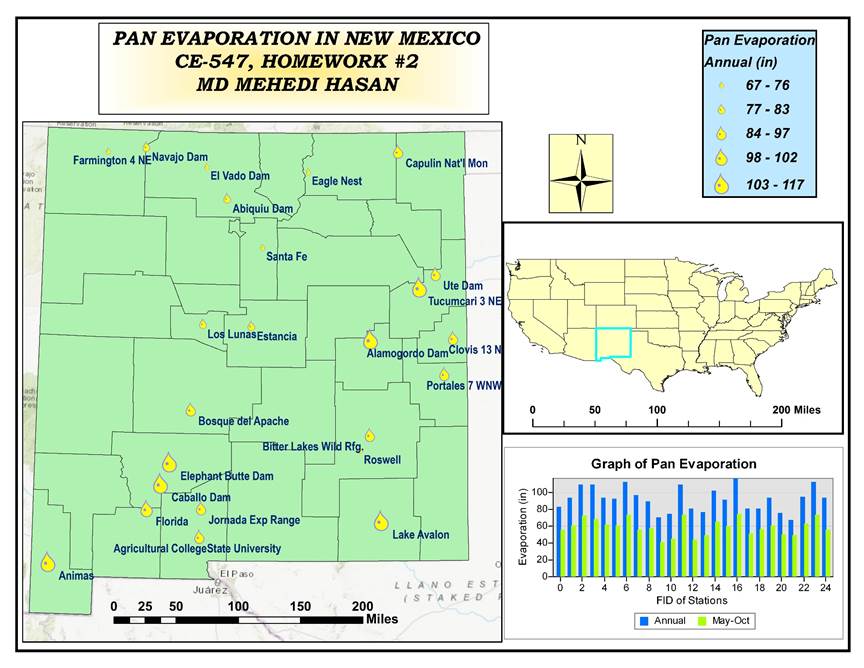
We can familiarize
ourselves with the ArcMap Environment by accomplishing this homework. The
primary objective of this homework is to create a map illustrating the pan
evaporation data for different regions in New Mexico.
In the first instances,
the pan evaporation data was extracted from the file downloaded from the link
provided in the unm learn. Then a base map was added. In the symbology tap
under the layer property, symbol size, shape and ranges were changed. Graduated
symbols have been used in this occasions. After that, a graph of annual
evaporation vs station name has been plotted. Evaporation for the month of May
and October was also shown in the same plot. Another data frame was added to
display the states of USA. Scale is shown in each map. Finally, all the
information are shown in a layout map.
I was having some
difficulties in doing this homework. It took a while to rearrange everything in
layout view. In addition, it took more time to make it presentable. I will keep
practicing to enhance my skill in this software.