Methods
Projection
All
maps were chosen to be in the NAD 1983 Universal Transverse Mercator zone 13
projection. The source datum worked best
in this projection and the area was small enough for this projection to
accurately present the study area in question.
Data Sources
The
National Map Viewer seamless data from the USGS for digital elevation models(DEM). nationalmap.gov
RGIS
for digital orthophotography, vegetation data and
geologic data. rgis.unm.edu
PRISM precipitation
data provided by Oregon State University.
http://www.prism.oregonstate.edu/
All
analysis was performed for this project in ArcMap except title image which was
accomplished in ArcScene.
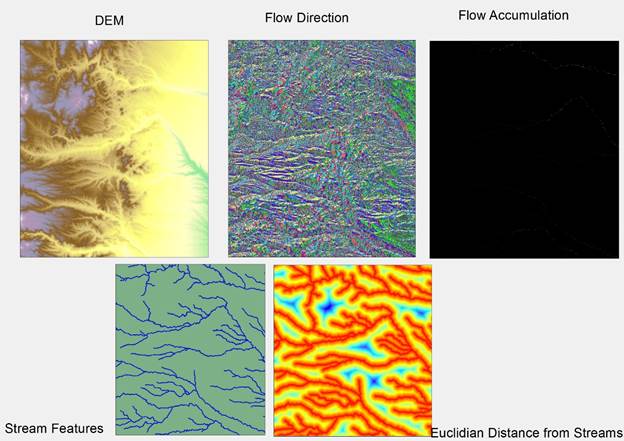
Hydrology
After
acquiring 2 large DEMs from USGS I merged the two than clipped it to the
property vector polygon. The polygon was
made using the draw tool while transposing a separate tif
map I acquired from the Ranch using property data from RGIS. Once I had a clipped DEM I used the hydrology
toolbox from the spatial analyst extension to fill the DEM to remove spurious
pits from the raster. Next a flow
direction raster was generated using the flow direction tool. Next, after several failed attempts to make a
weighted flow accumulation using the Prism 30 year precipitation mean data, we
discovered that the PRISM data needed to be resampled to match the cell size of
the DEM. After this resampling the flow
accumulation was generated from flow direction and the new precipitation raster. Once acquired, the raster calculator was used
to create a stream map delineating the top 1% of flow as a 1 cell and the rest
as a 0. Then using that raster the
stream to feature tool in the hydrology toolset created a line vector layer of
the streams in the Ladder. Using a
distance to feature tool a raster was created from the stream raster file with
distances to the stream.
Modeling
To
answer the question posed of where was the vegetation I decided that modeling
was the best tool for this purpose. I
felt that using raster calculations to transpose several elements was the best
way to come up with some kind of vegetation likelihood index. For the modeling several assumptions needed
to be made.
1. Water: Vegetation was going to be associated most
closely with the stream data, and precipitation would affect density of growth.
2. Slope: Vegetation would not grow in great capacity
on slopes greater than 30 degrees.
3. Aspect: As a proxy for solar property I assumed that
south facing slopes would have less vegetation than north slopes due to stress.
With
these assumptions I used the DEM to create an aspect and slope raster.
 Aspect Slope
Using
the raster calculator I created a series of conditional equations to create a
raster file with 4 values to denote likelihood of vegetation growing there.
Con("euclidiandistancestreams4"
< 60,1,Con(((("LadderSlope" < 30)
& ("AspectCalc" == 1)) /("ClippedPrismPrecipProjectedResampled"
)),2,Con(((("LadderSlope" < 30) &
("AspectCalc" == 2)) / ("ClippedPrismPrecipProjectedResampled" )),3,0)))