For
this project, factors such as Land use, major rivers and major roads were used
with different weightage. Land use was given 55% usage, major rivers 35% and
major road 10%. These weightages were purely based on assumption. Land use was
given more weightage assuming that it was more important to consider land
depending on its current use (water body, forest area, built up areas). Rivers
were give 35% because it was more important to base the site relative to river
since roads was the least important because constructing access road was easier
than controlling river or land use.
i.
Data sources:
Airport
data was obtained from the ESRI website. Nepal’s airports were refined from the
list of all airports around the world. The data for major rivers and majors roads were obtained from International Centre for
Integrated Mountain Development (ICIMOD). They work to study and share
information related to Hindu Kush Himalayas regions. Countries like Nepal,
India, Afghanistan, Bhutan, etc. fall in this region.


ii.
Projection used:
WGS_1984_UTM_Zone_45N projection was used with false
easting 500000 and false northing 0, central meridian was 87 and the linear
unit being in meters. This projection was used because Nepal lie in UTM Zone
44N and 45N. And the data are usually collected using the 45N projection.
iii. Software
environment:
The software I used was ArcMap. The software uses a
lot of memory which made the computer lag a lot at times. If I had more time, I
would have tried transferring my map to ArcScene and
get a 3D view of the site locations. I wanted to show the selected sites in
Google map but due to time constraint I was not able to work on it. The data I
used were all raster data. In the end, I had to convert the final map from
raster to polygon to calculate areas.
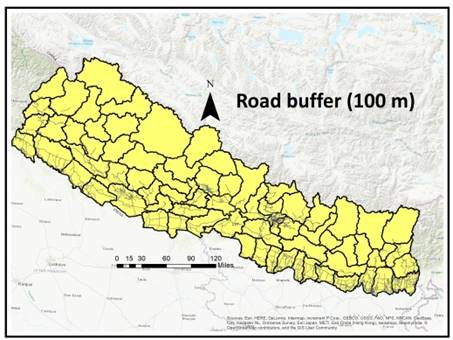
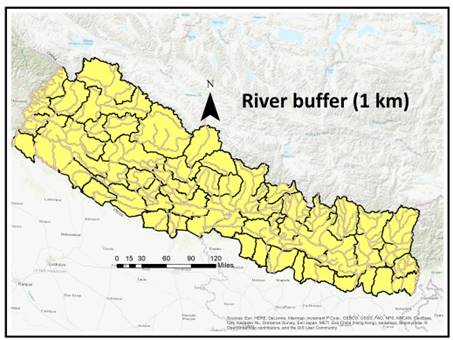
iv. Analysis:
The river data was buffered for 1km distance and the
road data was buffered for 100m distance. This was done basing on the
assumption that it is most suitable when it is closest to existing road. And
assumption that an airport should be at least some distance away from rivers. The
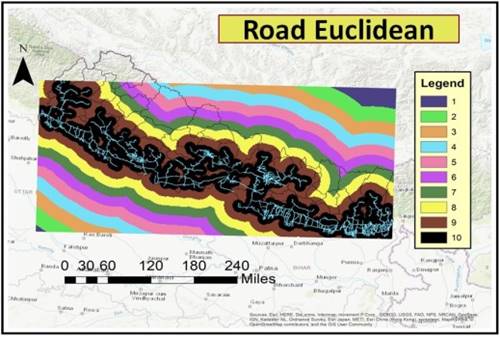
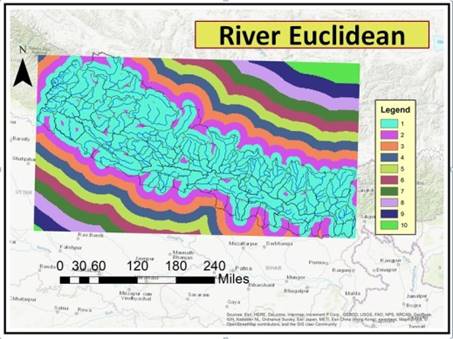
Euclidean map was obtained from the buffered map, using the Euclidean distance
tool. The map was then reclassified that represents closer to the road the
better and farther from the river the better. After getting the Euclidean map,
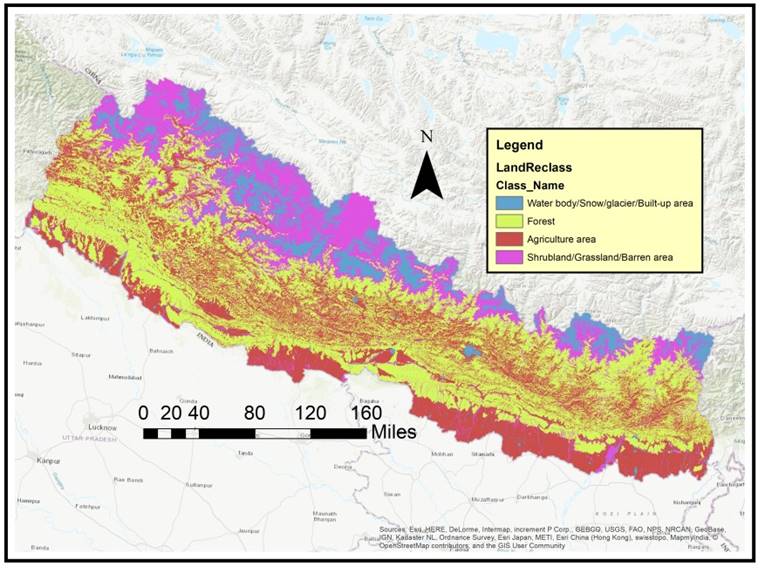
land use map was then reclassified according to suitability class. Shrubland/Grassland/Barren
Area being the most suitable and Water body/Snow/Glacier/Built-up area the
least suitable or unsuitable. All these tools were applied using the model
builder which was a very helpful and easy to understand because of its
flowchart format.
These three maps were then weighted using the raster
calculator, River*.35+Road*.1+Landuse*.55, to get the weighted map. After the
weighted map was obtained, majority tool was used to get a map that took the
majority area from the surrounding up to 4 cells. The map was again
reclassified in the range of 1 to 5. Where 5s are the most suitable and 1s is
the least suitable area for airport site. The map was then changed to polygon
using the conversion tool in order to calculate the
areas of the site. The areas were calculated using the calculate geometry tool
and the unit of the area is hectare. Only areas from southern plain was shown
assuming it is most feasible because of the very less varying grade land
structure. From the areas in the southern plain, different ranges of areas were
selected which were large enough for at least a two runway
airport.
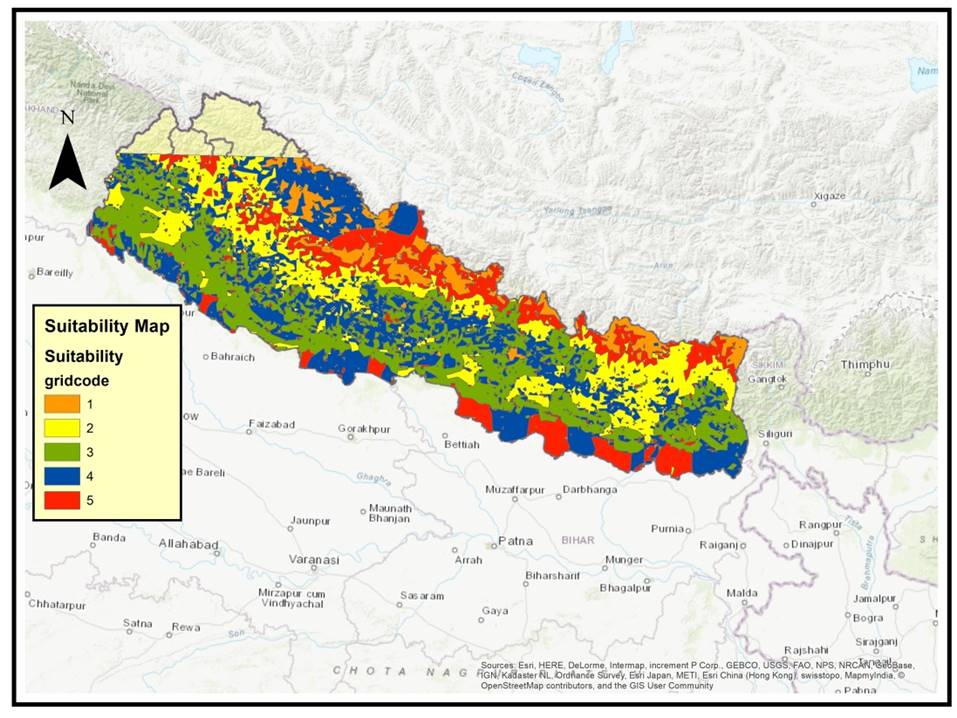
Figure 2:
Weighted Map