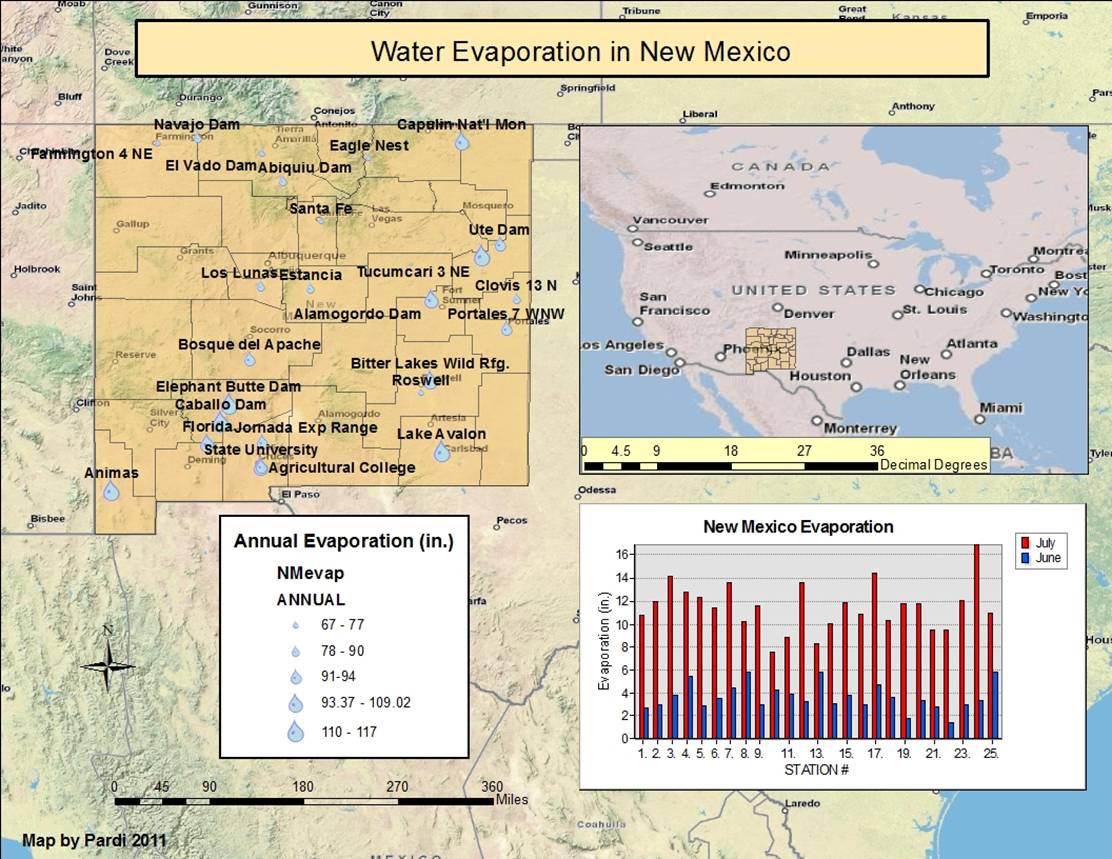
CE547 Assignment #2 Making a Map
For this assignment I tried to create a map that would tell a story about the amount of annual water evaporation in New Mexico annually. I added the class data and selected a physical map as a base. I adjusted the transparency and color of New Mexico so both the shape of the state and the underlying topography could be seen. Using the annual data, I created graduated symbols for each evaporation pan station under the “Symbology” tab in the layer properties. I used the quantile method for classification. The label for each range was cleaned up by rounding the values to the nearest whole number, eliminating decimals on the output and saving space.
I selected a water droplet as the map marker, and also increased the symbol size range to 8 – 25. The default setting was too small to really be seen well on the map. With these settings, a larger water droplet indicates more annual evaporation. I also added station names under the “Labels” tab in the layer properties. I adjusted their placement so that they would generally be above the station.
I added a new data frame and created a second map to show the relation of New Mexico to the rest of the United States. I selected a shaded topography base map that contained political boundaries, and overlaid the New Mexican map over it. I added a scale to both of my maps, and a North arrow for the larger map. Using the drawing toolbar I was able to add text for a title at the top and my name and the year in the lower left.
I wanted to show the difference in evaporation throughout the year, so I used the graph making wizard to plot the evaporation in July against the evaporation in January. I deliberately chose hot and cool colors for the hot and cold months, respectively. I had some trouble figuring out how to get the graph from the wizard onto my layout, but right clicking on the title bar and then selecting “Add to Layout” will get the graph where it should be. I found that adding guidelines and selecting “Snap to guides” helped arrange objects neatly in the layout.