CE547 HW#1
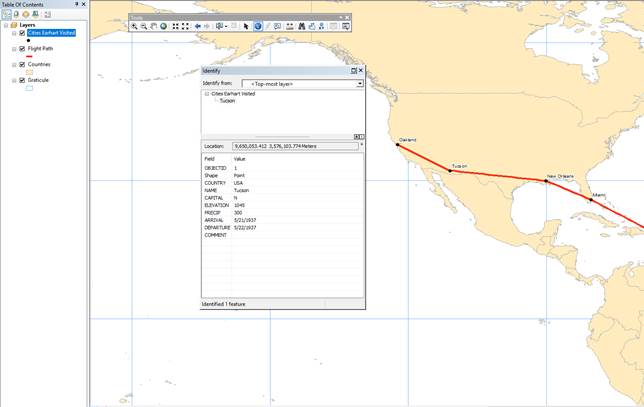
Figure 1 (Displaying Map Data). The figure displays a map of cities visited by Amelia Earhart. Information about Tuscon, AZ is displayed using the identify button on the Tools toolbar. This figure was copied using the snipping tool.
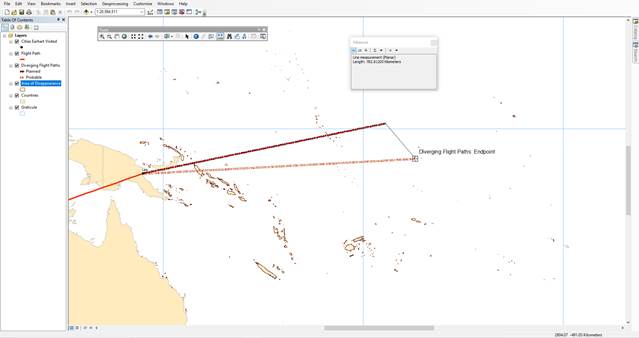
Figure 2 (Navigating a Map). The figure above displays Amelia Earhart’s diverging path flights from a planned route versus the probable divergent path. Using the measure tool, the two endpoints of diverging flight paths were about 782 kilometers apart from each other. This figure was copied using the print screen tool.
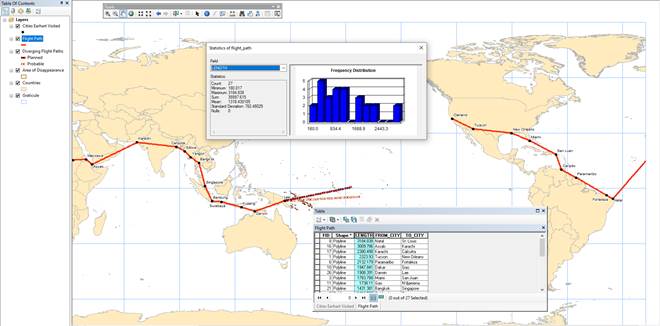
Figure 3 (Looking at Feature Attributes). The Figure above displays the functions of the attributes feature for the Flight Path layer. The frequency distribution of Amelia Earhart’s flights is also displayed by utilizing the statistics button for the length column. This figure was copied using the snipping tool.