Results:
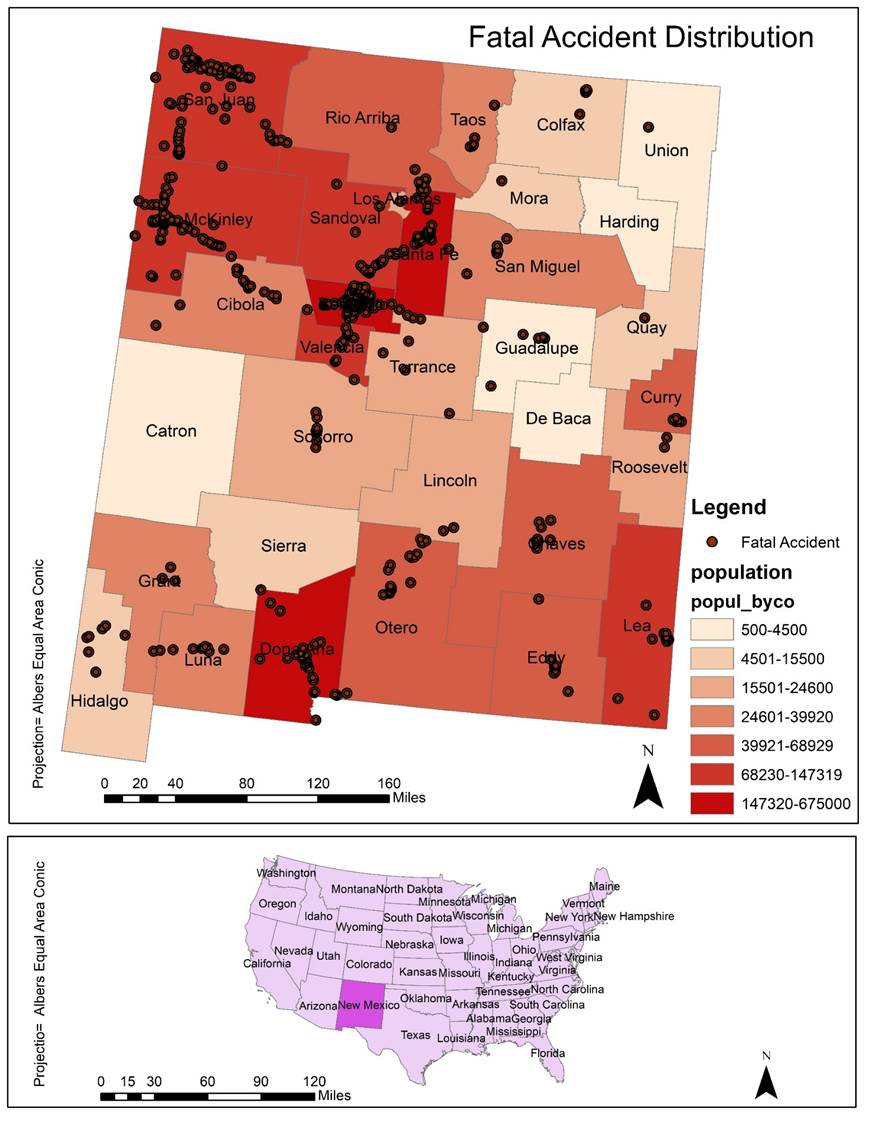
This
map is categorized by population. This map shows the Fatal
accident distribution by
points. According to observation in more populated county we had more accident.
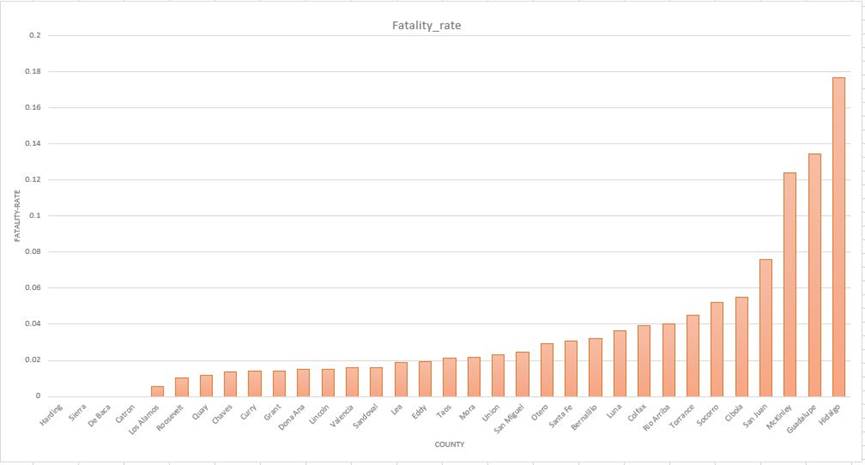
Fatal rate analyzes the rate of the fatal car crash
by considering population
“Alcohol-impaired-driving occurs when drivers have a blood
alcohol concentration (BAC) of .08 g/dL or greater. On average, 12.3% of the
drivers involved in fatal crashes were found to have either too much alcohol or
drug in their blood to be driving legally. That means annually, there are
roughly 5,500 drivers under the influence of alcohol, drugs, or other
medication when a fatal crash occurred.”
The
other question that I would like to answer is whether accident due to Alcohol-impaired-driving
more in the weekend or weekday?


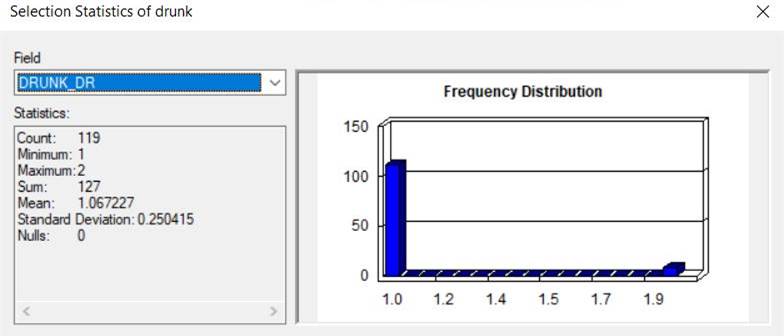
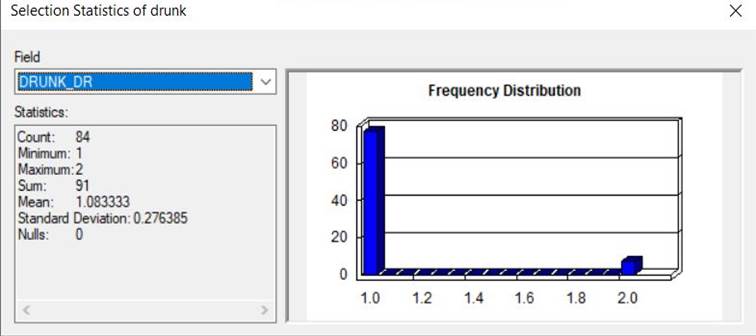
Method
of analysis: I used to select by location, and I use this Query: "DAY_WEEK"
= 'weekend' AND "DRUNK_DR" >=1
then I
select only selected data and use statistic to reach out the SUM. we have two
days of weekend and 5 days of weekday. So, 127/5=25.4 and 91/2=45.5 which
indicate more accident happened during weekend cause by Alcohol-impaired-driving.
That is why we need to be cautious during weekends.
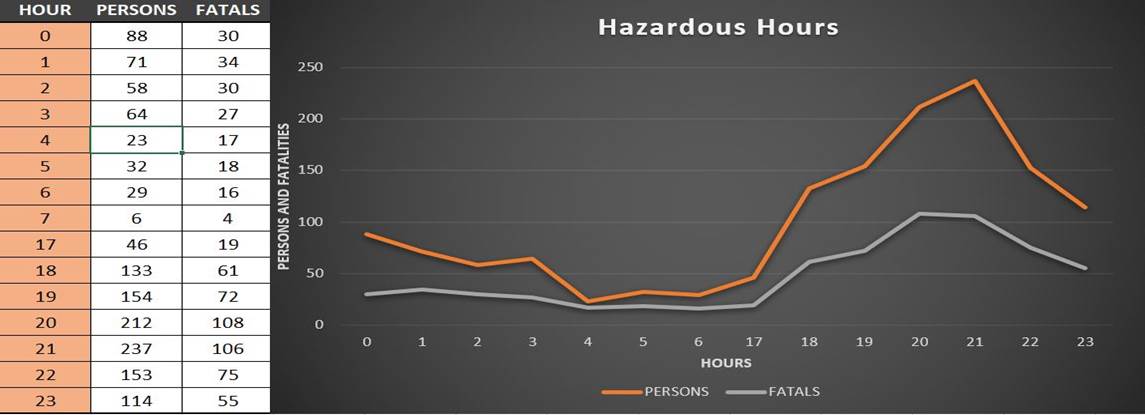
Another
important issue was hours of accident. According to the table number of
accidents increase after 17 and it reach to its peak in 21. 20 and 21 can be
considered as peak of Fatal crash in NM.
“in 2019,
an estimated 38,800 people lost their lives to car crashes – a 2%
decline from 2018 (39,404 deaths) and a 4% decline from 2017
(40,231 deaths). About 4.4 million people were injured seriously enough to
require medical attention in crashes last year – also a 2% decrease
over 2018 figures.” https://www.nsc.org/
The
other topic is that whether we have improvement in Fatal
crash since 2002 or
not?
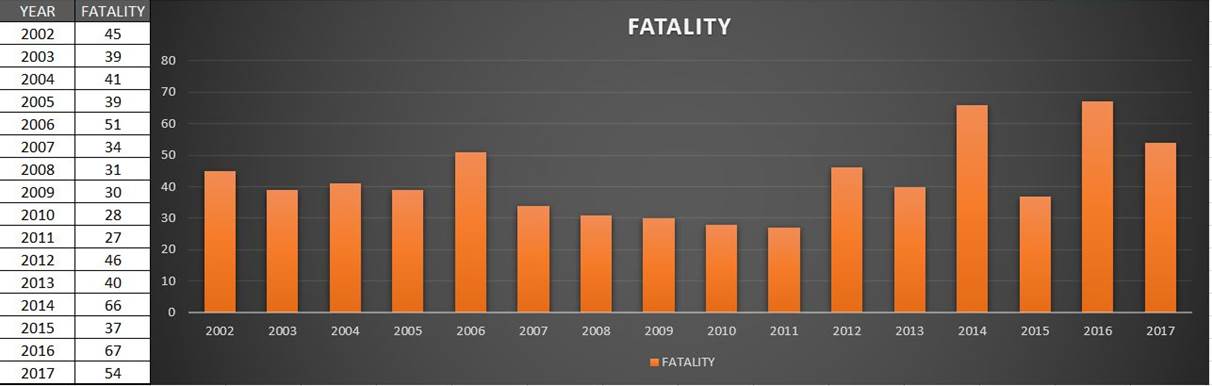
Increase
rate= 54-45/54=0.16
Number of vehicles regestred from 1991-2018
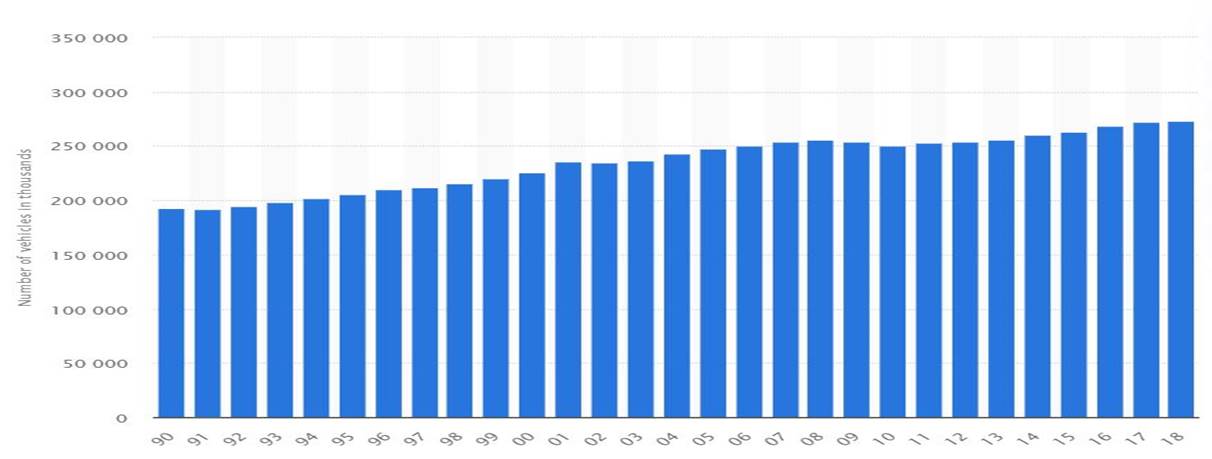
Number
of registered vehicles in 2017= 275000
Number
of registered vehicles in 2002= 225000
Increase
rate= 275000-225000/225000=0.22
0.2
(increase rate in fatal crash) < 0.22 (increase rate in registered vehicles)
so, improvement in fatal crash can be concluded.
by considering huge development in the safety of vehicles and the
progression toward increasing road safety, it can be concluded a big portion of
crashes caused by human error.