Home Work #5
in this exercise we learnt how to add temporal and
other excel data to our map, besides that i
learnt how to join data make attribute table, select by location and
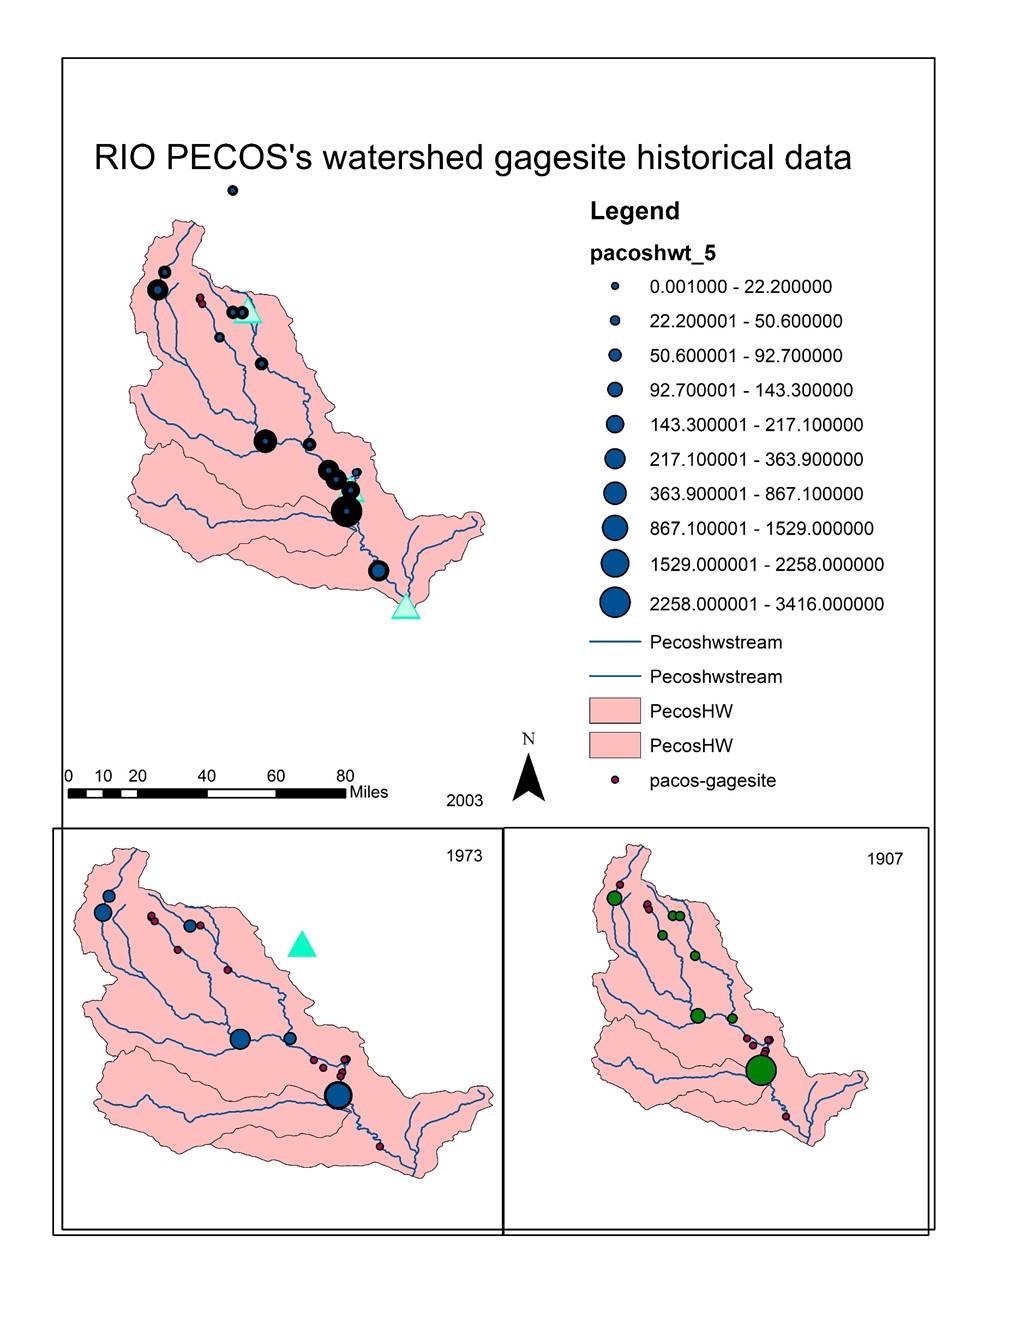
attribute and export data to new layer. 1 and 2: This assignment is about
figure out the discharge history of Pecos. In this homework, we learn how to
add data by HUC and temporal data to our map to show every change in the data
during the specific period. At first, we add HUC total data the we choose reg
13 by write down Query in HUC properties we choose a specific sub-basin by
that. Then we change the symbol of this sub according to codes. The we select
“CAT” = '13060001’. Then we are going to export that and it’s
going to be head water of Pecos After choosing Pecos by attribute I
choose another area by selection tool. Then we download the spatial data for
the headwater of Pecos and temporal data. And we should cleanup it because
header may cause problem in GIS. The we added table which show the gage site
location. 3: in this exercise we added the time to out spatial data and we
joined that data to Pecos gage site and did the same setting in x y for that
data as well, then we saved that as new layer. And we also play animation by
time slider tool which show the map feature during the times.