

|
|
|
|
|
|
|
|||
Basin Analysis
Step 1) Download data from RGIS and unzip. Next, Arc View 8x Tools were added to ArcCatalog to facilitate importing of Interchange files for using in ArcMap. Now conversion tools are available to import Interchange File.
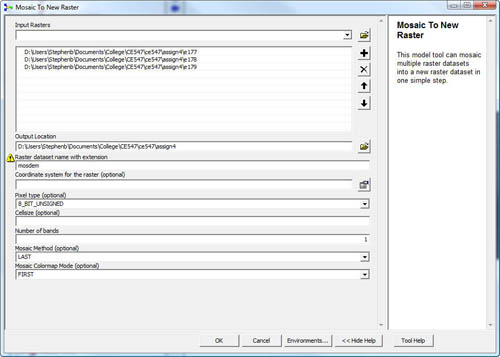
Step 2) Mosaic three downloaded files to New Raster using ArcToolbox. |
|
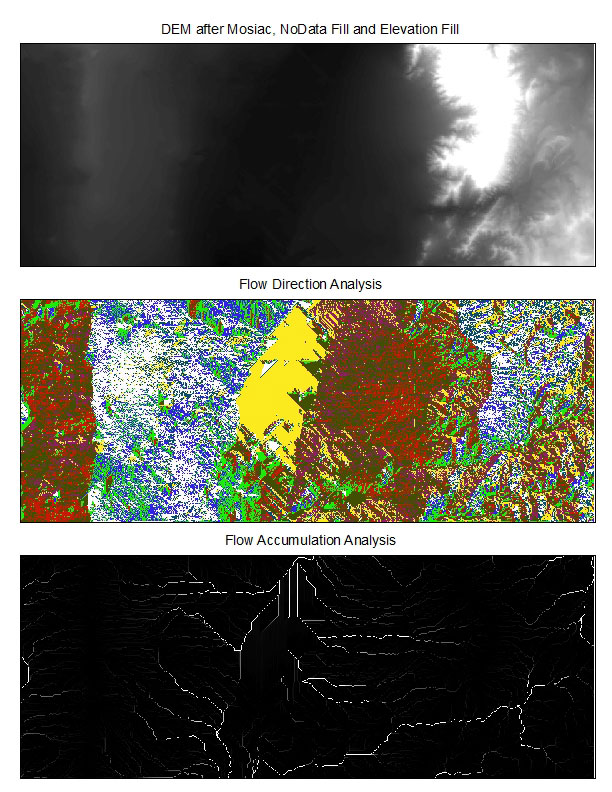
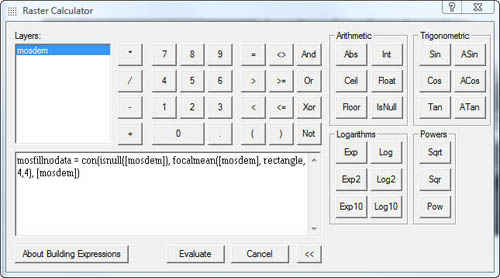
Step 3) Newly mosaiced file contains 'nodata' holes that need to be filled with interpolated data from surrounding cells. |
|
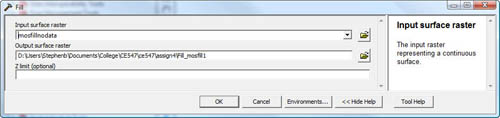
Step 4) The resulting DEM now needs to have elevation anomalies filled to produce accurate flow direction and accumulation data. Elevation inconsistencies (sinks) will skew the resulting flow calculations. Using the Fill tool brings these anomalies to values closer to surrounding cells. |
|
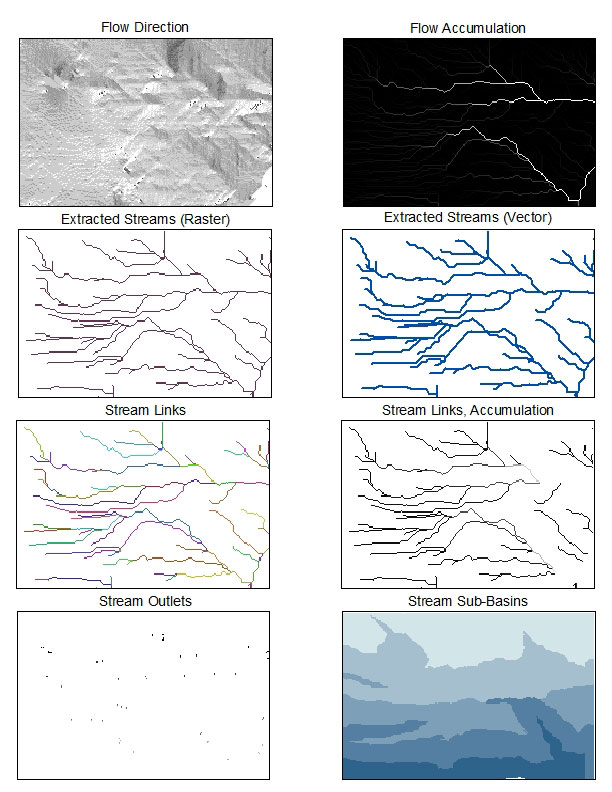
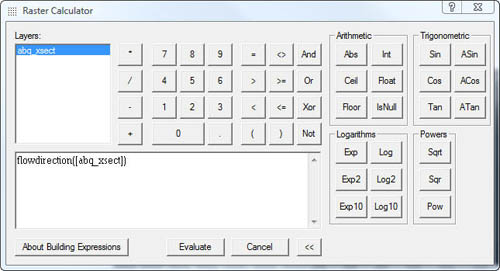
Step 5) Flow Direction can now be run on the prepared DEM. This examines each cell in the DEM and gives it a value from 1 to 128 depending which cardinal or intercardinal direction the lowest adjoining cell lies. 1 starts in the East and doubles every 45° running clockwise, ending in the North East at 128. |
|
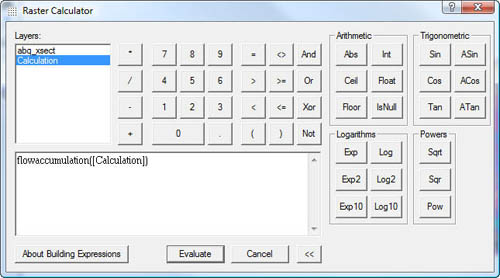
Step 6) Flow Accumulation totals all the flow entering and leaving a cell to produce a map illustrating the accumulation of water/fluids based on topography. |
|
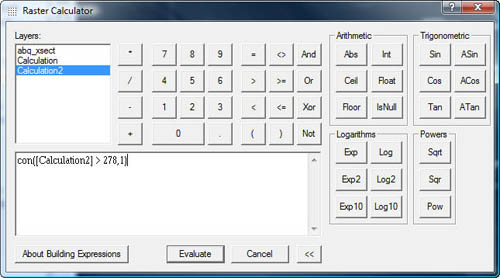
Step 7) Focusing on a detailed region, we begin to extract stream data. Using the con operation (conditional), Flow accumulations greater than 278 will be given a value of 1 and everything else will get a value of nodata. This will produce a raster map of the stream network in our study region. |
|
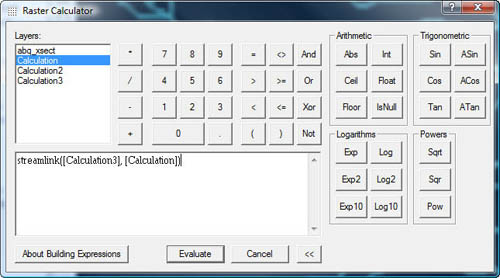
Step 8) Streamlink outputs all the sections of a stream between junction points. |
|
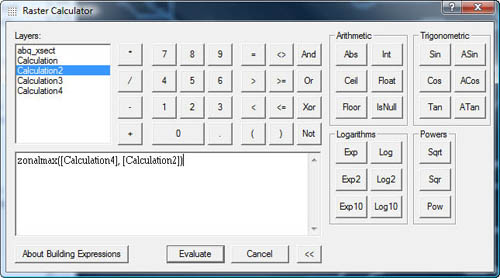
Step 9) Zonalmax takes the streamlink output and applies the flow accumulation output to show stages of stream increase in size/volume. |
|
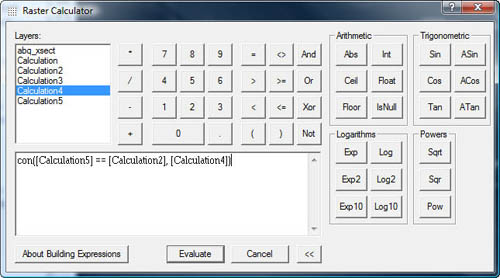
Step 10) Generates outlets of stream segments. |
|
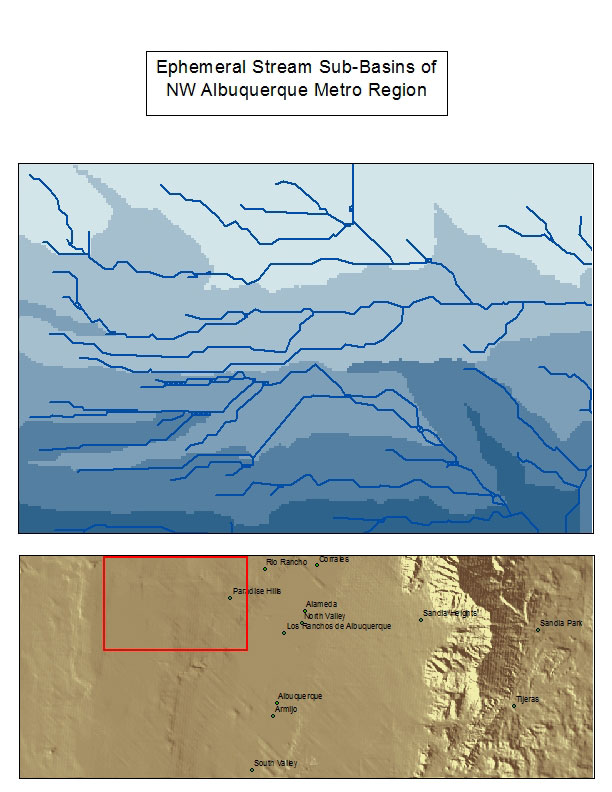
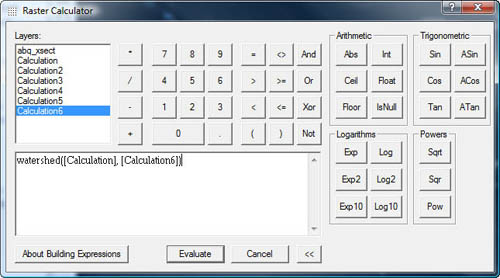
Step 11) Produces sub-basins upstream from outlets defined in Step 10. |
|
Step 12) The final step converted the output of Step 7 from raster to vector data using Convert > Raster to Features.
Issues: Entering the proper formula in Raster Calculator can be challenging. The Convert to Raster function for the stream layer produced 'knots' in the streams, likely due to the low resolution DEM we are analyzing.
Map Exports: