


Currently Being Prepared
Continuing Analyses and Developments - Being Revised and Updated
An Independent Study Project (Geography 691, Spring 2024)
Continuing Research During 2024 and 2025
Background
The former
Division of Government Research (DGR) at UNM developed a special purpose statewide
gravity model for measuring geographic access to health care facilities and providers
in New Mexico. This work was performed for the former
New Mexico Health Policy Commission (NM HPC) from 1998 through 2002
as an addition to comprehensive statistical work with New Mexico's health care data.
The results of this preliminary work were only
published on DGR's former web page and also in a
limited distribution publication by the NM HPC (
HPC Quick Facts 2003 -
color extract).
A special poster presentation
was also prepared that won the poster contest at the 2002 ESRI SWUG Conference held in Taos, New Mexico (
now Esri Southwest User Conference).
Many academic and applied research studies
have demonstrated the utility of a GIS
(Geographic Information System)
and spatial statistical methods (spatial analysis)
such as gravity models
for public health
(Selected References and
Esri Health and Human Services).
These evolving methods
(GIS-Based Accessibility Measures and Application)
have provided an improved higher resolution understanding of geographic accessibility (potential and relative spatial access)
than the official (traditional epidemiological) lower resolution regional availibility methods routinely used by government agencies.
However there is more research needed to help the selection of an appropriate model(s) to apply in a particular place.
New Mexico has some very unique social, economic, political, and topographic characteristics
that need to be considered when developing and applying these methodologies.
This research will consider these factors and hopefully result in the selection
of an appropriate and useful model(s) to measure geographic accessibility to health care providers and facilities.
Previous Developments
This page presents results from a countinuing comparision and evaluation of the original
DGR gravity model and other one-step gravity-based model methods to some of the more recently
developed two-step gravity-based models used elsewhere by other researchers.
For more background information
and results from previous preliminary research please see
(
Geographic Acces to New Mexico Health Care Providers and Facilities - original page).
A more comprehensive update focused on data acquisition, preparation, description and visualization
has also been previously prepared
(see
Geographic Acces to New Mexico Health Care Providers and Facilities - data preparation page).
In addition, another more recent page focused on data visualization and preliminary analyses
has already been developed
(see
Geographic Acces to New Mexico Health Care Providers and Facilities - analyses page).
The primary purpose of the previous and this continuing research is to
allow other researchers to review these results
and to make suggestions to improve the interpretation of these results.
This continuing analyses phase of research is focused on the development of a mixed or hybrid gravity model that
hopefully will produce more realistic and useful results for New Mexico.
Hopefully with the cooperation of others, especially researchers with a public health and statistical background,
portions of this interdisciplinary research may eventully be published
in an appropriate academic journal and presented at both academic and applied users confrences.
The findings of this research should also help promote the application of these methods in New Mexico by various state
governement agencies to assist policymakers in the NM Legislature to make more informed decisions
when allocating resources to help alleviate disparities.
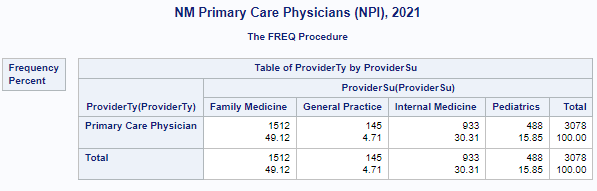
The official routinely updated New Mexico healthcare workforce data
(see New Mexico Health Care Workforce Committee 2021 Annual Report)
reports that an estimated 1,607 primary care physicians were practicing in New Mexico in 2020 (Pg. 36).
The data used for this report is not open source data
so I will be using
a reasonable substitute
based on the National Provider Identifier Standard
NPI
that was available on ArcGIS Online (AGOL)
but has unfortunately been removed since I acquired this data
(previously on AGOL:
COVID-19 Provider Practice Locations).
This data looks to be reliable for the purpose of this class research project
although it contains an overcount of 3,078 primary care physicians for New Mexico in 2021 as many are no longer active.
It is not possible with my limited resources to verify those physicians that are currently active or may only be part-time.
My primary research goal is a methodological comparision of gravity-based
models that are routinely used methods for measuring potential spatial accessibility to healthcare and other
essential services such as retail food stores.
More accurate data may be available in the future.
The results of this research could serve as an example and aid future studies
to identify an appropriate
gravity model method(s) that include better data.
Mixed Model Analyses (Continued)
Being prepared
The preliminary results from previous analyses indicate that there is not enough reasonable statistical evidence
to conclude that any potential geographic access gravity model is more realistic than any other.
Instead each model is likely illustrating a possible measure among a range of potential accessibility measures.
In essence, all models have some practical utility. Deciding which one or combination is the most appropriate
given a particular research objective can be somewhat subjective and often constrained by the availibility of reliable data.
I have used various example socioeconomic and health indices as a possible way to compare gravity model results.
As these indices are independent and mostly reliable current measures of population characteristics and aspects, it is reasonable
to explore their utility to estimate how realistic and potentially useful a particular gravity model is.
The strength of the correlations or relationships may be helpful to select an appropriate or more useful model(s).
However, this research may indicate that there is a counter-intuitive way of interpreting the poor
correlations with these indices.
These results may actually indicate how out-of-balance the distribution of primary care physicians actually is in New Mexico.
Example Socioeconomic Indices
My preliminary results indicate that potential two-step (2S) gravity models constructed using zip codes (supply - physicians)
and census tracts (demand - population) produce measures that are more strongly correlated with these indices.
I will be using this census tract and zip code (CTZIP) type of gravity model for the upcoming series of analyses.
A Web Map of results has been prepared:
View the Web Map in a new tab
Toggle side panel (top left) for Zoom, Layers, and Legend
(Click map feature for pop-up information)
I developed a very basic Social Determinants of Health (SDOH) index for New Mexico.
This is an essential component of this ongoing research and future versions for testing will be developed.
Hopefully other researchers including various SMEs (Subject Matter Experts) with more expertise
and resources will eventually work on subsequent developments as the
New Mexico Department of Health has not yet developed a composite SDOH index (see NMDOH Social Determinants of Health) similar to those developed in other states.
Some preliminary results with this test SDOH and the other currently available example indices are available below.
Note: I will be using a combination of
ArcGIS Pro,
ArcGIS Online,
ArcGIS Insights,
Python(
Jupyter Notebooks - JupyterLab with
GeoPandas and
matplotlib),
SAS
, and some R libraries
(see spgwr
,
mgwrsar
,
GWmodel
, and
tidyverse)
for these analyses.
Social Determinants of Health (SDOH) Index Development
I have used Esri's
Calculate Composite Index Tool (Spatial Statistics)
to develop a basic SDOH for New Mexico (see
Esri Technical Paper).
Recent census data is available from Esri for
geoenrichment
(
Blog: Got Five Minutes? Get to Know ArcGIS GeoEnrichment Service)
using the
Data Enrichment
service
(also see:
GeoEnrichment: A Location Service for On-Demand Demographics).
Some of these data are also available from Esri's
ArcGIS Living Atlas
and from the New Mexico Community Data Collaborative.
These recent data have been prepared by
Esri Demographics
- Esri Updated Demographics
and have been used to develop their Socioeconomic Status Index
(SEI).
A recent Esri User Conference has a presentation
Creating Indices: Combining variables to make better decisions
and a resource page
Creating a composite index using ArcGIS Pro
have been helpful.
Spatial Access Index and Ratio (SPAI and SPAR) and Sensitivity Analysis
The standard measure of physician availability in a geographic area is the
physician-to-population ratio (PPR). I have used a slightly different terminology of physician-per-population
(PHYS_PER_POP) as a variable/item name or just Phys when convenient. PHYS_PER_POP or Phys is the same as the standard PPR.
Both one-step and two-step gravity models calculate an initial measure of potential spatial accessibility
(see
Wiki: Two-step floating catchment area method),
labeled the Spatial Accessibility Index (SPAI) by recent studies.
The PPR is a component of both the one-step and two-step gravity models
and the PPR can be derived from the SPAI calculations.
The PPR is easier for government agencies and policymakers such as state legislators to use
and facilitates presenting this information to the public.
The SPAI (Spatial Accessibility Index)
and the related SPAR (Spatial Access Ratio), a statistical data rescaling method
(not a typical standardization or normalization)
are used primarily in academic studies to compare results and enhance statistical mapping.
As more reliable data become available, I will use PPR instead of Phys in subsequent applied research studies.
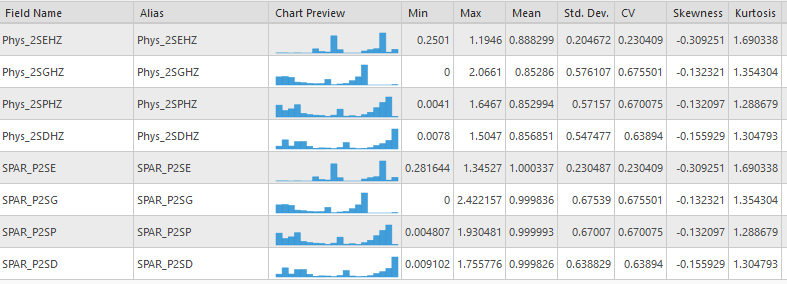
The following statistical summary table
(see ArcGIS Pro Data Engineering)
and graphics (being prepared) show the two-step gravity model results and the
corresponding SPAR's. These are Two-Step (2S) Hybrid Zonal (HZ) gravity models
with different distance decay functions (E - Exponential, G- Gaussian, P - Power, and D - DGR Power).
All using road distances from an Origin-Destination Matrix (ODM) with census tracts (population - demand) and
zip codes (physicians(Phys or P) - supply).

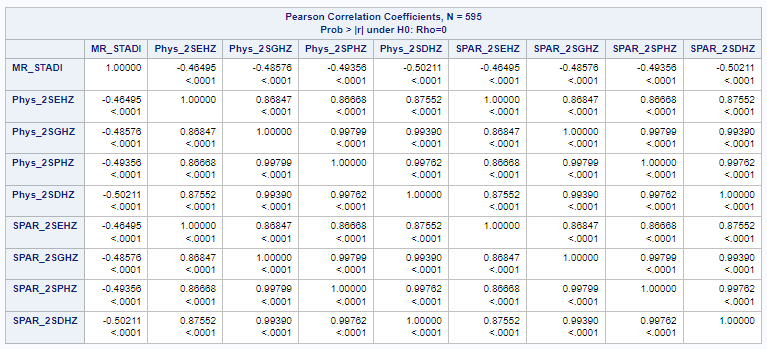
The previous summary tables, correlations (with UWM-ADI from
SAS),
and maps
(from Python matplotlib) indicate that the SPAR is not necessary or
an appropriate measure for this study.
There are no differences in the shape of the distributions (Skewness, and Kurtosis are the same)
and only the range (Mean, Std. Dev, Min, and Max) of the data are altered.
The correlations with the PPR results (PHYS) and UWM-ADI (MR_STADI) are also the same.
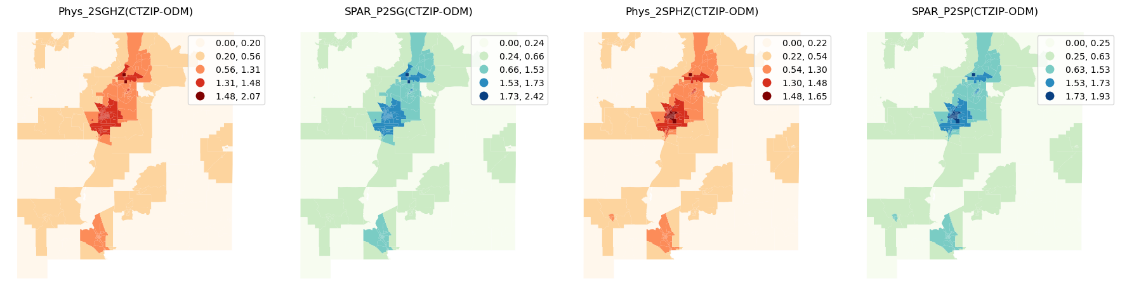
Further, the maps for two example gravity model results (Gaussian-G and Power-P distance decay functions)
are essentially similar when comparing the PPR (Phys) map and the SPAR map (the E and D results are also similar).
Other studies that are comparing various impedance weights for distance decay functions have found the SPAR useful when
conducting sensitivity analysis
to evaluate uncertainty in the various model results.
These studies have indicated that the SPAR is more stable and not as sensitive
to the choice of various impedance weights than the SPAI.
It was not necessary to conduct sensitivity analysis for this more basic study as various impedance weights are not being
evaluated, just the standard distance decay functions that are part of the one-step or two-step gravity models.
The choice of potential accessibility
gravity model to employ and distance decay function to use are based on the correlations with available
socio-economic and health related indices. These indices are independent aspects of the population. They can be
used with additional spatial-statistical methods to help quantify disparities and identify problem areas.
Exploratory Regression Analyses
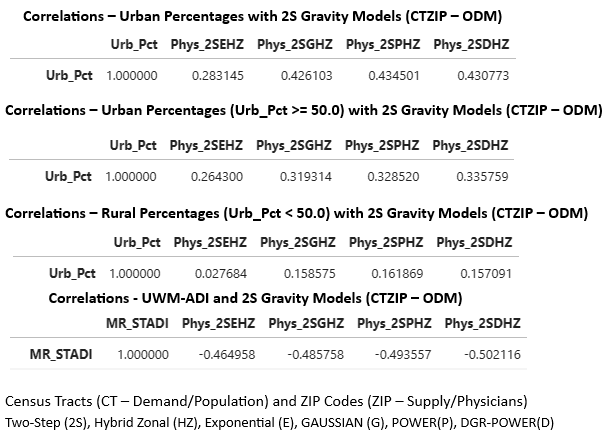
The following tables show
correlations between
urban (Urb_Pct >=50.0) and rural (Urb_Pct < 50.0) classifications of census tracts
obtained from the
Urban and Rural Population Data (US 2020 census) and the two-step (2S-CTZIP) gravity models.
Plus correlations between UWM's Area Deprivation Index (ADI) and the two-step (2S-CTZIP) gravity models.
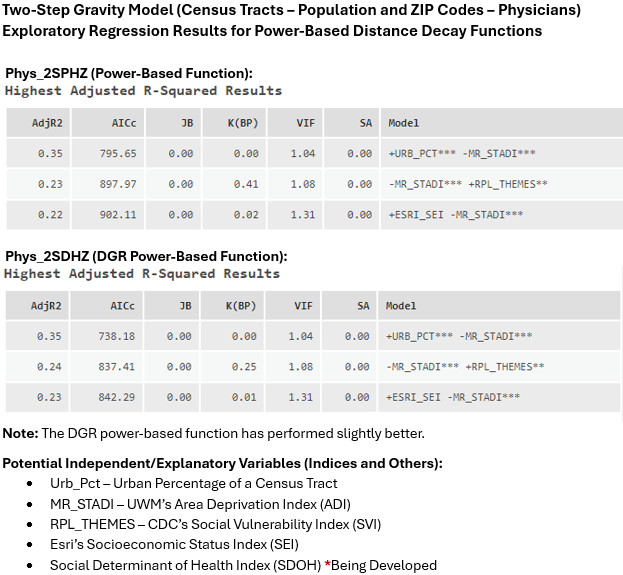
Both of the power based (P and D) distance decay functions had slightly greater correlation coefficients than either the exponential (E)
or Gaussian (G) distance decay functions and are being used as dependent variables in the regression analyses.
These are the initial results obtained using Esri's ArcGIS Pro
Exploratory Regression.
These results are weak but significant.
The most explanatory two variable models are with census tract Urban Percentage (Urb_Pct) and the UWM's Area Deprivation Index (ADI - MR_STADI).
Note: The MR-STADI variable is a measure obtained from the mean (rounded) value of all the block groups in a census tract.
There may be some data aggregation and statistical bias problems associated with the modifiable areal unit problem (
MAUP)
and the uncertain geographic context problem (
UGCoP)
that need to be addressed.
This will require more research to understand how these spatial problems can affect the regression results.
Hopefully the current test results will improve with the addition of a SDOH index.
I have developed a preliminary and basic version of a Social Determinants of Health (SDOH) index for testing using
Esri's Calculate Composite Index Tool (Spatial Statistics).
It is modeled on the
North Carolina Social Determinants of Health (
also PDF) Z-score based index.
However, I was not able to completely duplicate this method as I could not get all of their variables
from
Esri's Data geoenrichment
and used some reasonable substitutes.
Note: A positive Z-score is greater than the New Mexico average (higher need).
A negative Z-score is lower than the state average (lower need).
Regardless, I think this test SDOH index looks reasonable and somewhat realistic (see the Web Map below).
Unfortunately it was not as useful as I had hoped and its addition only slightly improved the previous
regression results obtained without it (see below).
I will be conducting more research and hope to develop some additional test SDOH indexes for New Mexico
that could prove more useful in the future.
For instance, the Agency for Healthcare Research and Quality (AHRQ), US Department of Health and Human Services
Social Determinants of Health Database (
AHRQ SDOH Database)
that has recently been updated to include both 2020 census tracts and zip codes for the entire US,
and the
The Council on Environmental Quality (CEQ)
that has prepared the Climate and Economic Justice Screening Tool (Justice40 Initiative)
that contains various indicators (indices)
that are potential sources of data.
I should eventually be able to develop a reasonable composite SDOH Index for New Mexico from the combination of
selected data items available from these resources.
This will be a longer than expected effort and hopefully I can get suggestions and assistance from other
researchers with more expertise and experience in public health, demographics, and statistics.
View the Web Map in a new tab
Toggle side panel (top left) for Zoom, Layers, and Legend
(Click map feature for pop-up information)
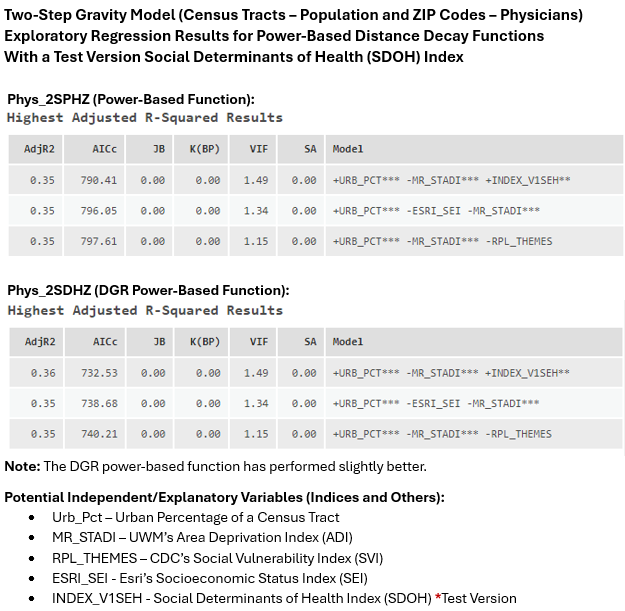
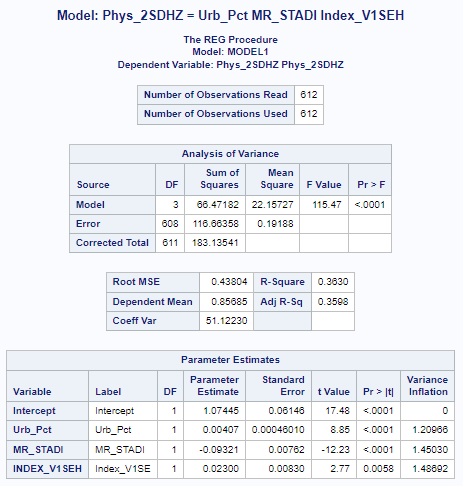
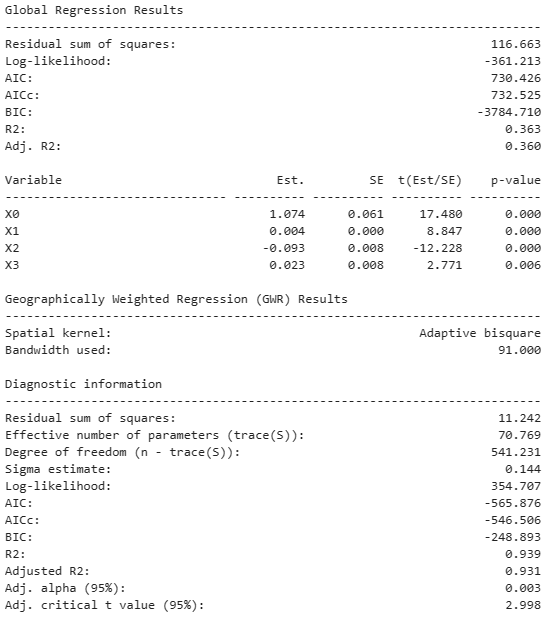
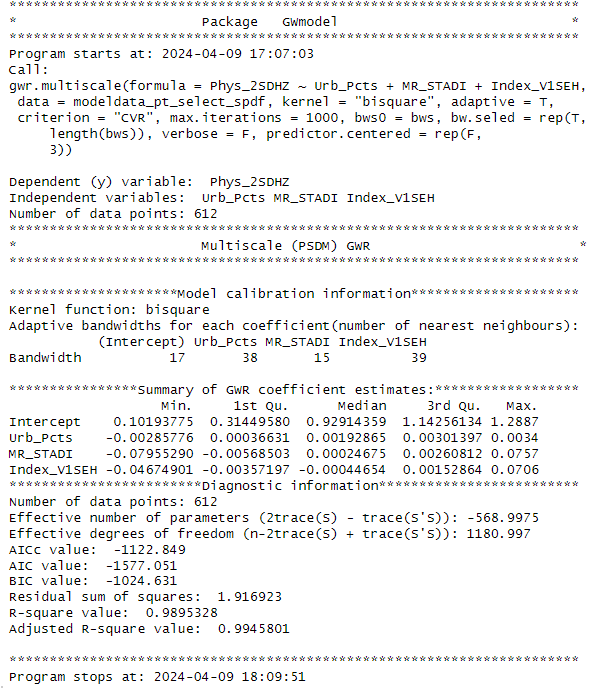
The exploratory regression results indicate that the global model that uses the DGR power-based function gravity model as the dependent variable (Phys_2SDHZ)
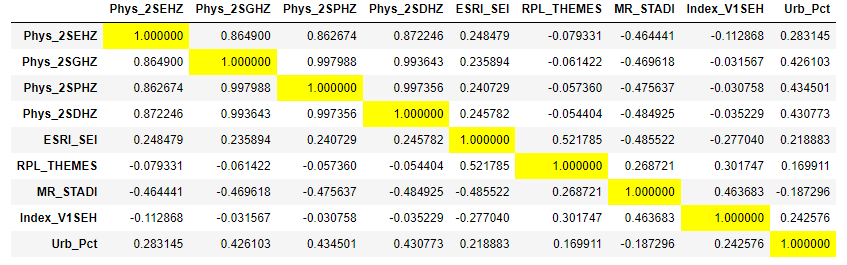
and three independent variables (URB_PCT, MR_STADI, and INDEX_V1SEH) has the lowest AICc and highest AdjR2. The following Python (pandas) table also
shows that all the two-step gravity models using census tracts and ZIP codes (CTZIP-ODM) are more strongly correlated with the MR_STADI socio-economic index.
The SAS global regression (REG Procedure) results with associated Variance Inflation Factors (VIFs < 10.0, a test for multicollinearity)
indicates only a moderate correlation or association between the independent or predictor variables
(see Multicollinearity in Regression Analysis:).
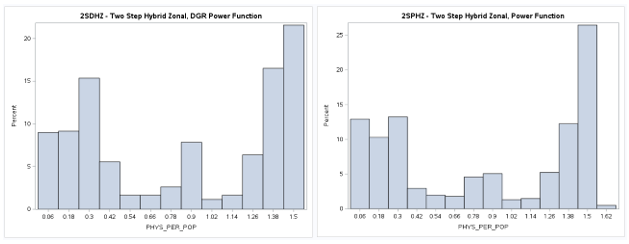
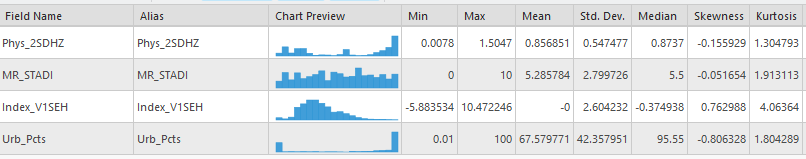
Although the distribution of the dependent variable (Phys_2SDHZ) is somewhat multimodal
as depicted in the following SAS histograms of both power-based gravity model results (Phys_2SDHZ and Phys_2SPHZ), a transformation
of this dependent variable or the other independent variables (see ArcGIS Pro summary statistics below) to improve the
global regression results is not necessary as this global regression is just the initial phase of these analyses.
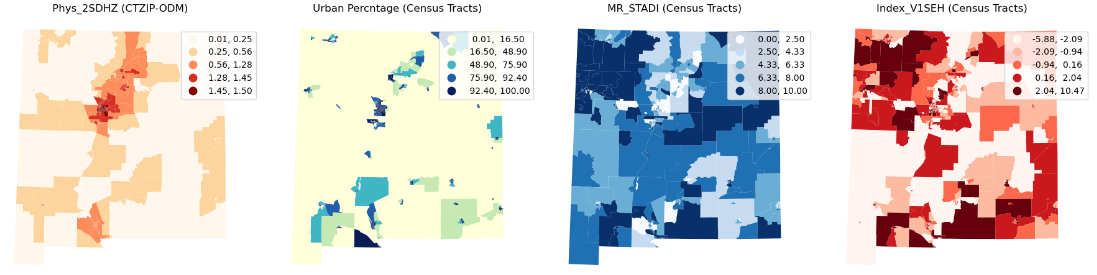
Basic map graphics of the non-transformed dependent and independent variables for this selected model
are also shown below. Both a Geographically Weighted Regression (GWR) and Multiscale Geographically Weighted Regression (MGWR) will be performed using this
model to hopefully improve the results and extend its utility.
All the variables will be standardized for efficiency in these local regression models and potential data transformations
(see Data Transformations (statistics)
and Should I Always Transform My Variables to Make Them Normal?)
will be evaluated to determine if model performance can be improved without hindering explainability.
GWR and MGWR Analyses
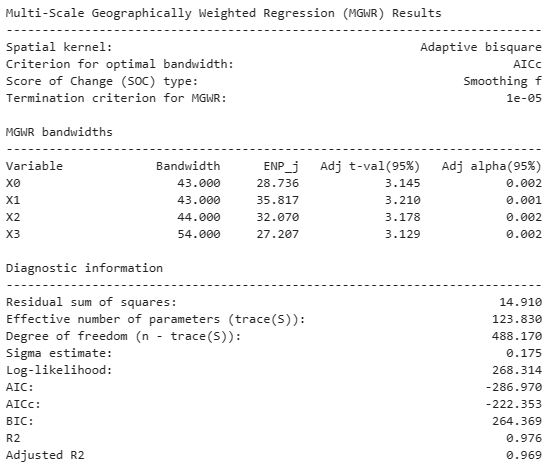
Both Geographically Weighted Regression (GWR) and the more recently developed Multiscale Geographically Weighted Regression (MGWR)
are used to explore and model the relationships between data that are non-stationary and vary spatially over a study area.
GWR will develop a separate regression equation for each locations dependent variable by considering the explanatory variables
within a defined neighborhood. MGWR is a more advanced method that allows the size of neighborhood for each explanatory variable
associated with each dependent variable location to vary in size. MGWR should produce more accurate results as allowing for explanatory
variable neighborhoods to vary in size is a more realistic way to model the spatial variations of real-world processes.
MGWR can more accurately estimate the regression coefficents at various neighborhoods
as the relationships between the explanatory variables and the
dependent variable may not be the same, and are more realistically operating at different spatial scales.
Both spatial regression methods should prove useful for identifying and measuring areas that exhibit socio-economic and health
disparities in relation to the gravity model measures of potential spatial accessibility.
I will be using ArcGIS Pro for both
GWR and
MGWR
(see YouTube).
I will also use the Windows desktop version of
MGWR and GWR developed by the Arizona State University,
School of Geographical Sciences and Urban Planning
(ASU-SGUP) for comparing results.
An additional source of useful information about GWR and related applications is available from Columbia University,
Mailman School of Public Health
(see Geographically Weighted Regression).
The ArcGIS Pro GWR Tool (an older local regression model) analyses has failed due to the problem of multicollinearity
(Error 110222: Unable to estimate at least one local model due to multicollinearity (data redundancy)).
The MGWR Tool (a newer local regression model) is not as easily affected by the multicollinearity (data redundancy) problem.
The MGWR Tool will also calculate a GWR model but it failed to calculate the results
(Warning 110471: GWR results could not be calculated for comparison.).
This local multicollinearity problem of explanatory variables that are highly correlated with each other
is only apparent and produces an error when using the ArcGIS Pro version of GWR.
It seems to work without error and produce GWR results when using the Windows desktop and Python versions of MGWR (see below).
I will do more research to understand this problem and suspect that investigating the distribution of local
Variance Inflation Factors (VIFs) will be helpful.
However, the MGWR results (see below) look to be somewhat realistic, and are a good preliminary example
of how this method can be useful
for identifying and measuring areas that exhibit socio-economic and health disparities.
This is only an example (test demonstration)
of the statistical and spatial methodologies that can be used.
It can be improved when the official physician and better SDOH data eventually become available.
Use caution interpreting these preliminary results.
A Web Map of results including layers for the dependent and explanatory variables of the model has been prepared
(see below).
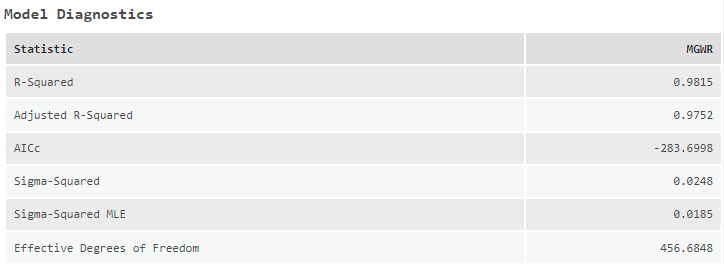
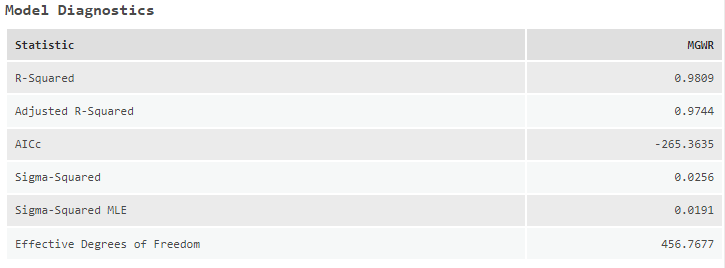
Additional Note: The second table from the ArcGIS Pro MGWR tool shows the results after the
urban percentage (Urb_Pct) explanatory variable was modified to change the zero valued census tracts to
a new explanatory variable (Urb_Pcts) with a value of 0.01. This additional problem of a singular matrix
was noticed when using the Windows desktop version of MGWR (see below). However, it only slightly affected the results.
I have not yet updated the ArcGIS Online Web Map to reflect this insignificant difference.
View the Web Map in a new tab
Toggle side panel (top left) for Zoom, Layers, and Legend
(Click map feature for pop-up information)
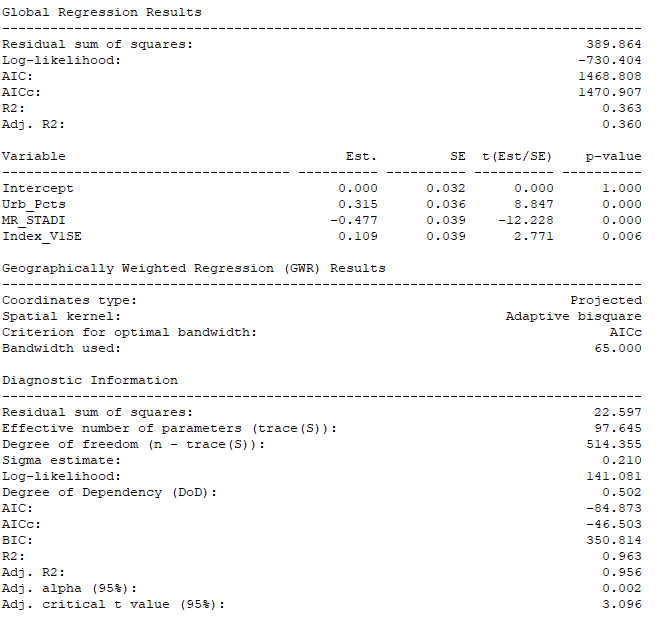
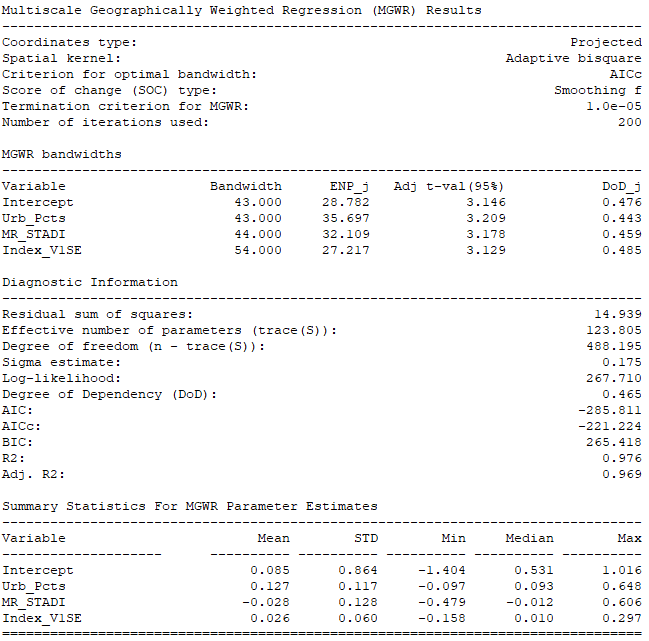
In addition, I am using the Windows desktop version of
MGWR and GWR developed by the Arizona State University,
School of Geographical Sciences and Urban Planning
(ASU-SGUP) for comparing results.
I have encountered a problem related to a singular matrix (numpy.linalg.linalg.LinAlgError: Matrix is singular.)
when attempting to calculate both GWR and MGWR using the selected model.
After changing the zero value census tracts (132 of 612 census tracts) to a value of 0.01 in a new
explanatory variable (Urb_Pcts), the Windows desktop
version of MGWR (both GWR and MGWR) worked.
This adjustment produced the following results (see below) that are similar to the
ArcGIS Pro results (see above). Note: The explanatory variable named "Index_V1SEH" now "Index_V1SE" had the
last character truncated when converting to a dBase file from an ArcGIS Pro Geodatabase.
In order to further investigate the singular matrix problem using Urban Percentage (Urb_Pct)
explanatory variable and the problem of local collinearity
I am also using the Python version of MGWR-GWR to compare results.
The MGWR results are similar to the ArcGIS Pro
and the Windows desktop MGWR-GWR results and are presented below.
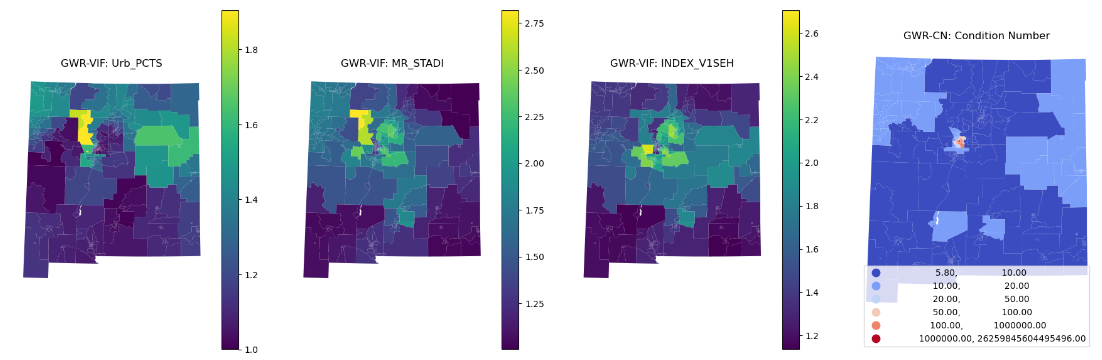
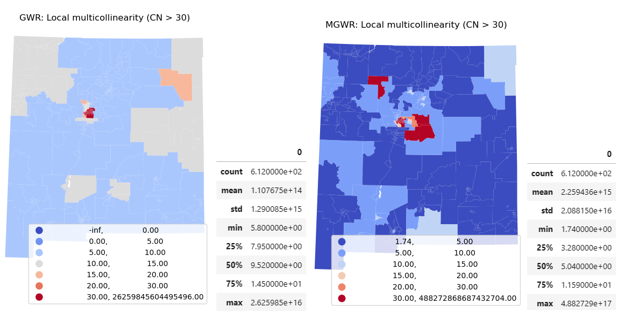
Although GWR produced results, the multicollinerity problem is clearly illustrated
by the map plot below (GWR-CN: Condition Number) as the central New Mexico,
Albuquerque metropolitian area has many census tracts with large condition
numbers (CN > 50). But the local Variance Inflation Factors (VIFs) do not
accurately portray the multicollinearity problem as the values are below 10.0
(VIF < 10.0). As such, the GWR results are problematic and the enhanced MGWR
method is currently preferred for this example
(test demonstration) model.
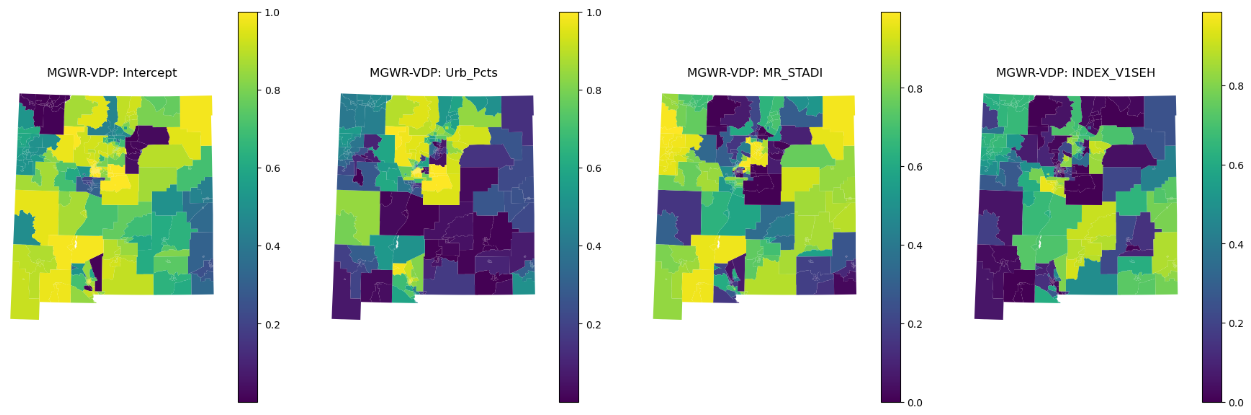
However, the MGWR method for this model also appears to have multicolinearity problems
with many Variation Decomposition Proportions greater than 0.5 (VDPs > 0.5) throughout the state.
I am doing more research to better understand how this impacts the MGWR results.
Additional Note: I have had a problem accessing the standardized residuals (std_res)
and local R2 (localR2, "Not yet implemented for multiple bandwidths")
for MGWR but they can be accessed for GWR.
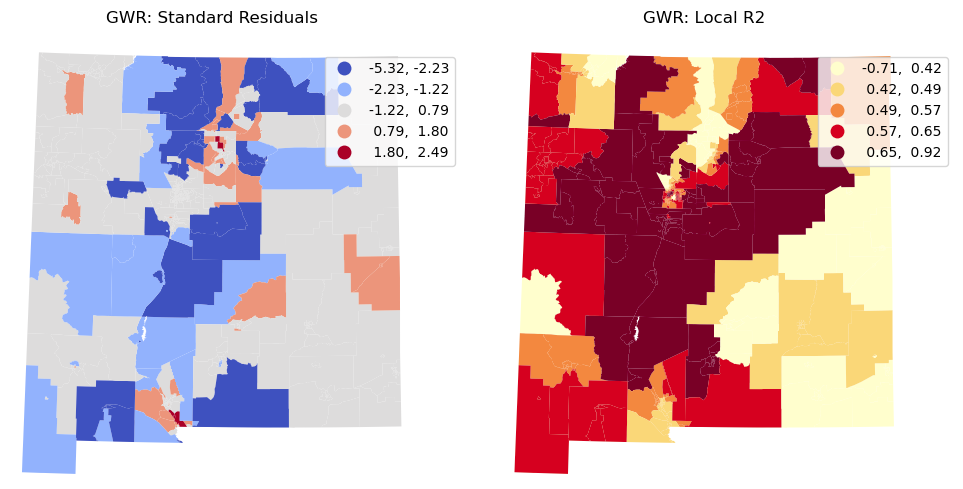
The following map plots and associated descriptive statistics tables show the multicollinerity
condition numbers (CN) for both the GWR and MGWR methods. I am currently doing research to understand
if these levels of local multicollinearity or high levels of collinearity between explanatory variables
are problems that could severly impact the GWR and MGWR results.
A quick review of published research has indicated that GWR and model interpretation may not be adversely
affected by moderate multicollinearity, although extreme cases can be problematic
(see
Fotheringham and Oshan, 2016).
Another study (see
Comber et al., 2022)
provides guidance and a route map for helping users successfully apply GWR and MGWR models
while also emphasizing the iterative process of model development.
I will be incorporating these suggestions and improved revisions of the previously prepared
initial models are being developed.
Note: I also do currently not understand why the GWR map has negative infinity (-inf) values.
I am also using some R libraries
(see spgwr
,
mgwrsar
,
GWmodel
, and
tidyverse)
to evaluate and compare results.
The MGWR results from GWmodel are similar to those from the Python packages (see below). However,
the longer compute time and slight differences may be due to the model input data not being standardised.
Note: The Univ. of Leeds, Geog3915: GeoComputation and Spatial Analysis Practicals
have been an invaluable learning resource.
I am also currently learning about multiscale varying coefficent modelling using a geographical Gaussian process
(GGP-GAM) as presented by (Comber et al., 2023) to see if any model improvements can result.
Note: This research needs to be undertaken before developing any of the
mixed (hybrid) models. This will take more time and effort beyond the spring semester.
Mixed (Hybrid) Model Development
Being prepared
Basic Hybrid Model with Different Distance Decay Functions
I plan to further investigate the possibility that notably different measurements can result for
urban areas as opposed to rural areas of the state.
One type of distance decay function
(exponential, Gaussian, or power) used in the gravity model could be more appropriate for urban
areas as opposed to another in rural areas.
A mixed or special hybrid model could be constructed
that provides a better accessibility measurment for the state if
slightly different gravity models were used in an urban versus rural setting.
Note: Developing and testing this type of hybrid model is planned
and I hope to work on this next as I find time berween other activities during 2025.
I have most of the data, but I may need to use the recent urbanicity type classifications developed by Esri (See
12 Things to Know About Urbanicity Data).
Hopefully it will not require much more computing resources or an extensive effort.
Urban Block Groups and Rural census tracts Hybrid Model
I plan to also investigate if a higher resolution model using census block groups and actual
physican locations in urban areas is more appropriate than using census tracts and zip codes
for aggregated physician counts. The two-step (2S) model was originally developed in urban
and regional settings based on higher resolution geographical data collection units.
Combining higher resolution accessibility measurments in urban areas with lower resolution
accessibility measurments in the sparsley populated areas of the state may provide more
useful results.
Note: Developing and testing this type of hybrid model
will require much more computing resources and effort.
I hope to start this work sometime soon.
New Mexico Legislative Districts Demonstration
Being prepared
I have updated some of my previous web maps to include the administrative boundaries for
the New Mexico Legistature's
(Senate and House districts).
The following discussion demonstrates that useful results from the potential
geographic accessibility gravity models can be obtained when based on legislative districts.
The legislative districts population (demand) data
and physician (supply) data from zip codes were used for the two-step (2S) gravity models.
Geometric and some modified centroid locations have been used to construct
road distances from an Origin Destination Matrix (ODM).
Eventually population weighted centroids from voting precinct could be used instead of geometric centroids.
I have also evaluated
various one-step (1S) gravity models that produce a composite index of supply and demand based
solely on legislative districts without incorporting zip code (supply) data.
Note: The resulting maps, analyses,
and results are made possible using data from the
Redistricting Data Hub.
I think these shapefiles are for the final redistricting plans. They will
be updated with current revisions if necessary.
The first step in developing and testing a geographic access gravity model for New Mexico's legislative districts
is to prepare a Social Determinants of Health (SDOH) index.
I have developed a preliminary and basic version of a SDOH index for the NM Legislature's house districts using
Esri's Calculate Composite Index Tool (Spatial Statistics).
It is modeled on the
North Carolina Social Determinants of Health (
also PDF) Z-score based index.
However, I was not able to completely duplicate this method as I could not get all of their variables
from
Esri's Data geoenrichment
and used some reasonable substitutes.
Regardless, I think this test SDOH index looks reasonable and somewhat realistic (see the Web Map below).
Note: A positive Z-score is greater than the New Mexico average (higher need).
A negative Z-score is lower than the state average (lower need).
This composite SDOH index will be used in subsequent regression analyses similar to the previously
conducted analyses with census tracts.
View the Web Map in a new tab
Toggle side panel (top left) for Zoom, Layers, and Legend
(Click map feature for pop-up information)
The second step uses both
SAS and
ArcGIS Pro)
to prepare both two-step and one-step gravity models to measure the potential geographic accessibility
to primary care physicians for each of the New Mexico Legislature's house districts.
For two-step models the number of physicians (supply) will be aggregated to zip codes and the population (demand) are the
population counts used for the subsequent reapportionment process after the 2020 census.
Both Euclidean (Generate Near Table - GNT) and road distances (Origin Destination Matrix - ODM) will be used with
several distance decay functions(exponential, Gaussian, Power, and DGR).
Note: Previous results (above) have indicated that using zip codes for aggregated physician counts can produce
gravity model results that are more correlated with SDOH indices (also aggregate data)
than the seperate or actual physician locations.
Using zip codes also takes less computing resources and cost (see ArcGIS Online Credit Costs)
especially when an ODM is employed for the distance measurements.
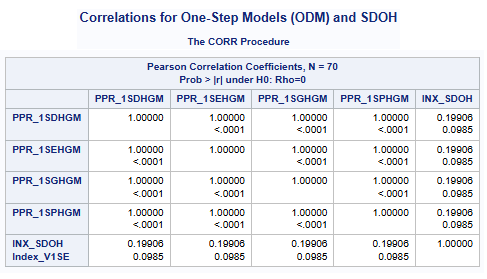
The one-step models will count and aggregate the number of physicians for each house district (supply) and also use the population (demand)
of each house district in the model calculations. The correlations of each one-step and two-step model with the SDOH index will be calculated.
The model with the best correlation will be used in the third step regression analysis to map the distribution of socio-economic
and health disparities.
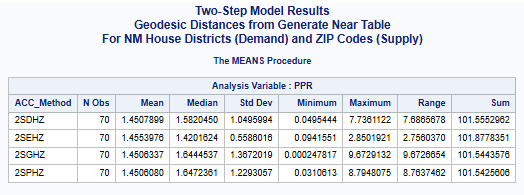
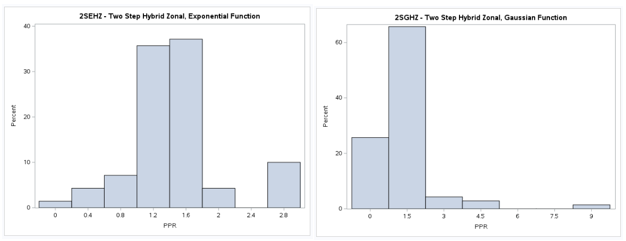
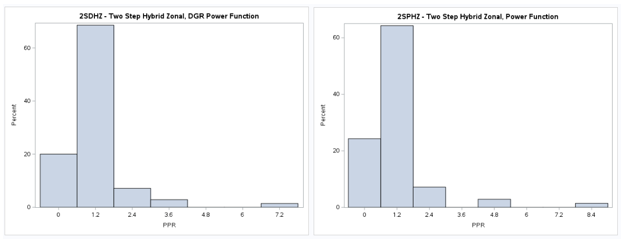
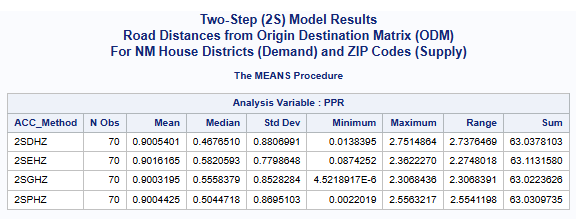
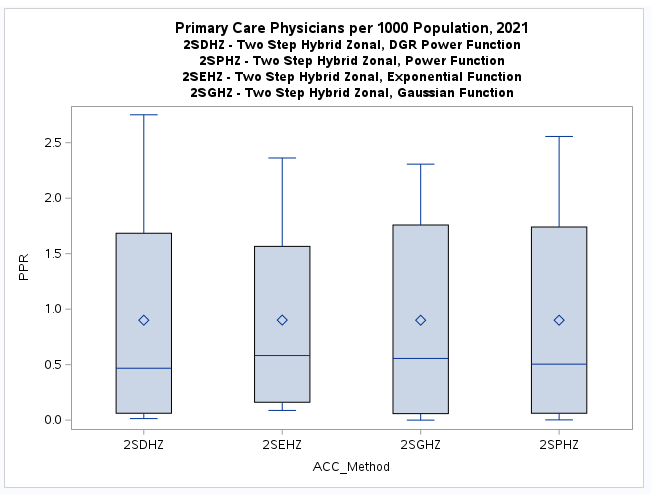
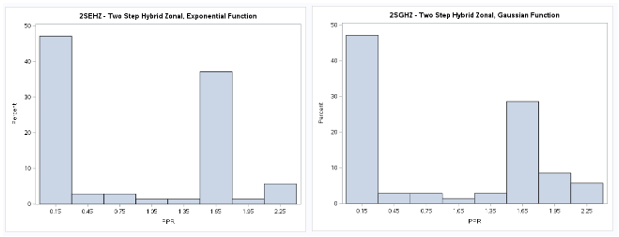
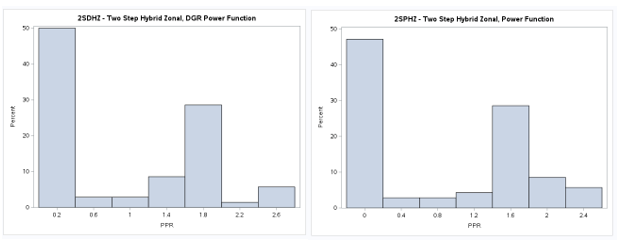
Two-Step (2S) Model Results, GNT
A table of descriptive statistics, boxplots, and a histograms (below) clearly summarize the results.
There is an obvious difference in the shape of the distributions that used the exponential (2SEHZ) distance
decay function and the others (2SDHZ - DGR Power, 2SPHZ - Power, and 2SGHZ - Gaussian) that are somewhat
similar. However, all are very close to the statewide average (1.89336 per 1,000 population)
and (1.45689 per 1,000 population) for all census tracts.
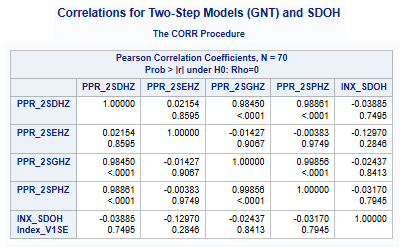
A web map of these results has been prepared that includes a layer for the test SDOH index.
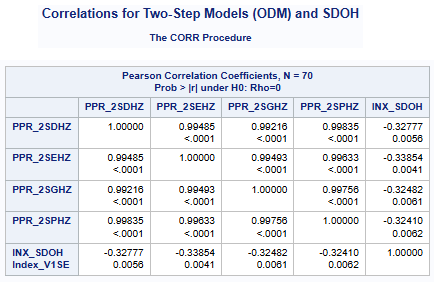
The correlations between the gravity model results and the test SDOH (INX_SDOH) are all negative and weak although the
relationship between the model using the exponential (2SEHZ) distance decay function and the test SDOH is somewhat stronger.
The negative relationships indicate that house districts with a higher PPR tend to have a lower need SDOH index.
The subsequent section using an ODM (being prepared) may or may not yeild similar results.
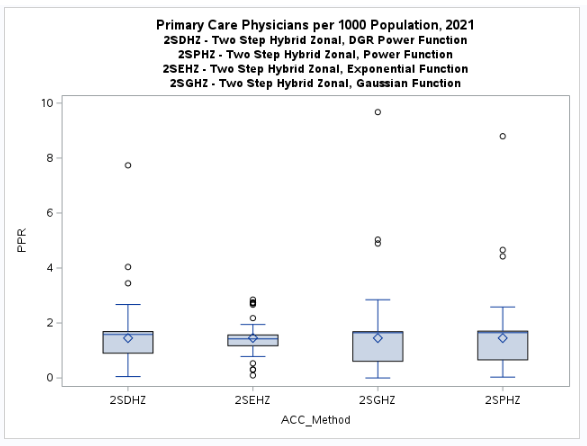
Accessibility Method(ACC_Method): Two-Step(2S), DGR-Power(D), exponential(E), Gaussian(G), power(P),
and Hybrid-Zonal(HZ).
View the Web Map in a new tab
Toggle side panel (top left) for Zoom, Layers, and Legend
(Click map feature for pop-up information)
Two-Step (2S) Model Results, ODM
The initial results using road distances from an ODM were disappointing.
This was partially due to the use of geometric (center of gravity) centroids for the house district polygons
(some very large and not compact) obtained using the ArcGIS Pro
Feature to Point Tool.
I have repositioned many of these centroids to be located closer to existing roads within actual populated places
instead of the many empty (low or non-populated) areas of New Mexico.
Another alternative would be to calculate population weighted centroids and distances using the voting precincts
that compose each house district.
However, this alternative will take more time and effort but could be employed once updated and official data becomes available.
The results (see below) show an improved correlation with the SDOH index compared with the other one-step (ODM and GNT)
and two-step (GNT) models although still rather weak.
For demonstration purposes, I will use the exponential model (2SEHZ) with a correlation of -0.33854 in the third step
to illustrate how a regression model can be developed to map the relative distribution of socio-economic and health disparities.
Accessibility Method(ACC_Method): Two-Step(2S), DGR-Power(D), exponential(E), Gaussian(G), power(P),
and Hybrid-Zonal(HZ).
View the Web Map in a new tab
Toggle side panel (top left) for Zoom, Layers, and Legend
(Click map feature for pop-up information)
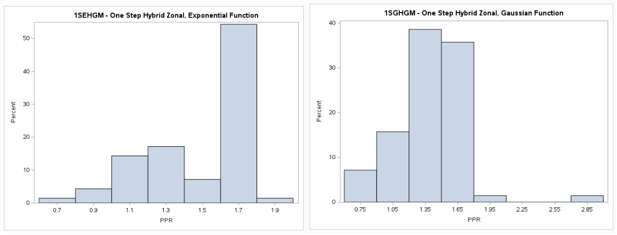
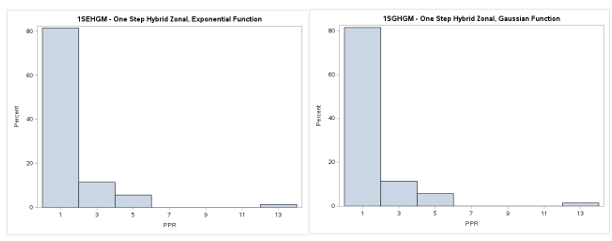
One-Step (1S) Model Results, GNT
The one-step (1S) gravity model results with house districts for both physicians-supply and population-demand
are similar with the exception of the exponential model that is more compact with
a lower maximum value (see histogram and boxplot below).
Note: The distances are based on the modified house districts centroids where some were moved closer to
roads in a populated city or town instead of an unoccupied rural inaccessible location.
The correlations with the SDOH index are slightly improved with the better results obtained for both the
exponential and Gaussian distance decay functions.
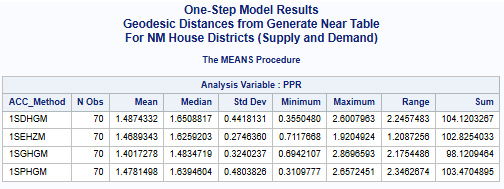
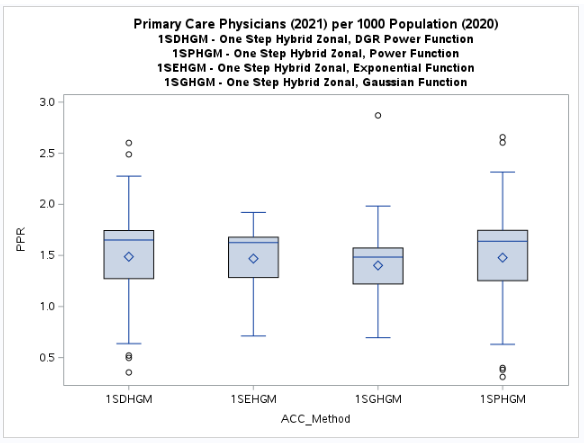
Accessibility Method(ACC_Method): One-Step(1S), DGR-Power(D), exponential(E), Gaussian(G), power(P),
and Hybrid-Zonal(HZ) - Hierarchical Gravity Model (HGM).
View the Web Map in a new tab
Toggle side panel (top left) for Zoom, Layers, and Legend
(Click map feature for pop-up information)
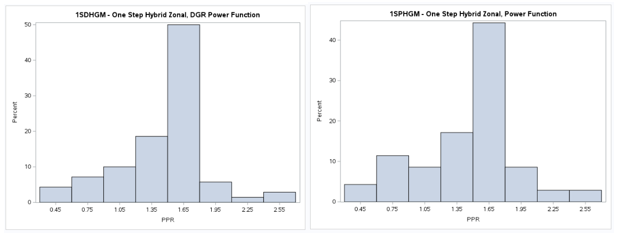
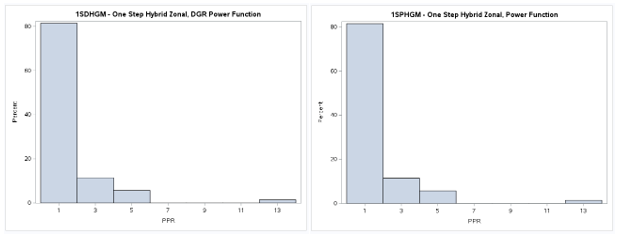
One-Step (1S) Model Results, ODM (Being Prepared)
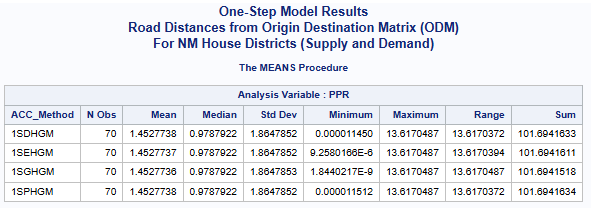
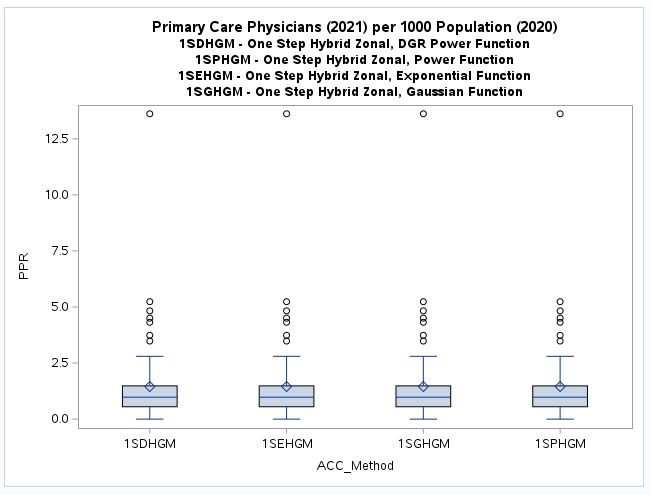
The one-step (1S) gravity model results with house districts for both physicians-supply and population-demand
are almost exactly the same which was a surprise
(see histogram and boxplot below).
Note: The distances are based on the modified house districts centroids where some were moved closer to
roads in a populated city or town instead of an unoccupied rural inaccessible location.
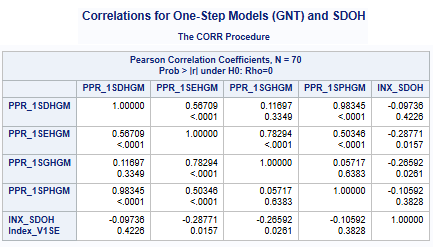
The correlations with the SDOH index are also the same and weak for all the models.
Accessibility Method(ACC_Method): One-Step(1S), DGR-Power(D), exponential(E), Gaussian(G), power(P),
and Hybrid-Zonal(HZ) - Hierarchical Gravity Model (HGM).
View the Web Map (being prepared) in a new tab
Toggle side panel (top left) for Zoom, Layers, and Legend
(Click map feature for pop-up information)
The third step uses statistical regression analysis
and residual maps to help identify areas (house and eventually senate districts) that exhibit
various levels of socio-economic and health disparities in relation to gravity model measures of
potential spatial accessibility.
However, there are not enough observarions for local spatial regression models such as
GWR and
MGWR therefore
a global regression models such as the
SAS REG Procedure with the
SGPLOT Procedure
and the
ArcGIS Pro GLR Tool will be the appropriate methods to use.
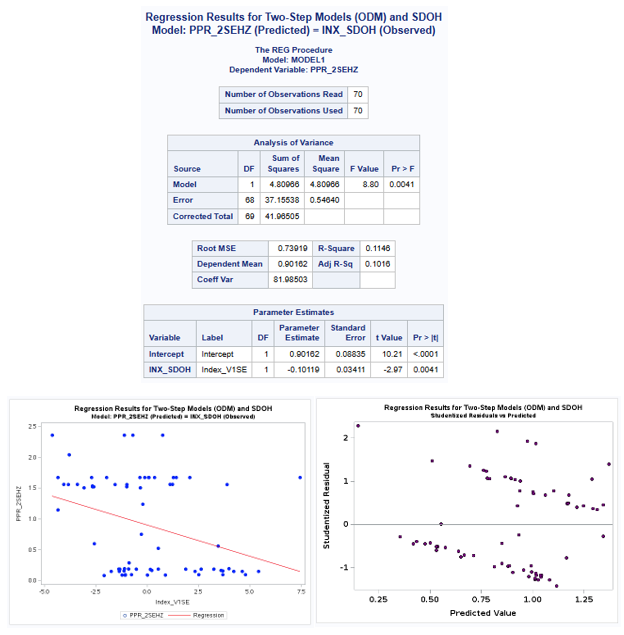
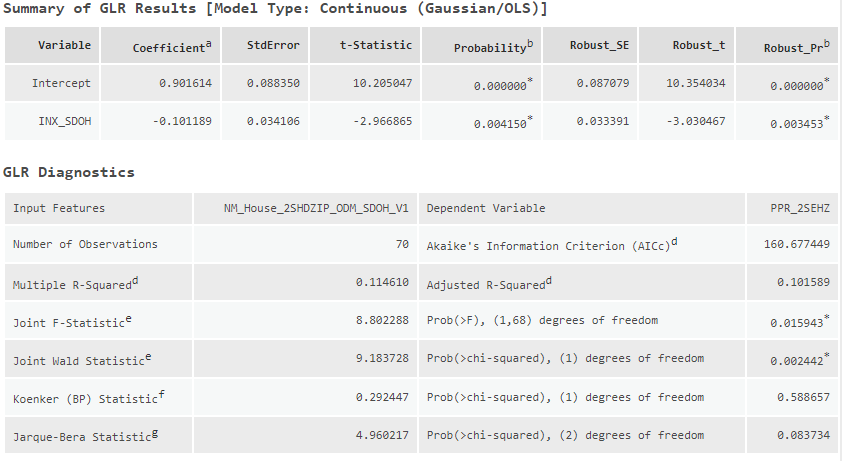
The regression results from both SAS and ArcGIS Pro are presented below.
Although this example (test demonstration) regression model measures a weak
negative relationship (Adj. R2 = 0.101589),
the regression coefficients (parameter estimates)
are significant as is the overall model (p < 0.01).
The general trend is that the need or disparities in a house districts decreases (positive to negative INX_SDOH)
as primary care physician accessibility (PPR_2SEHZ) increases.
The regression equation [PPR_2SEHZ (predicted) = 0.901614 -0.10189(INX_SDOH) + e] indicates that at about 1.0 primary care physicians per 1,000 population
the SDOH index becomes negative indicating less relative socio-economic and health disparities.
Although this regression example looks to be somewhat realistic and useful, it should be considered mis-specified or not complete.
It is important to understand that this example regression model has important
assumptions (see Ordinary Least Squares) for standard
statistical applications that can be violated when applied to spatial data.
The normality of the data should be evaluated and transformations
(see Data Transformations (statistics)
and Should I Always Transform My Variables to Make Them Normal?)
are usually acceptable, but can make the interpretation of results more difficult.
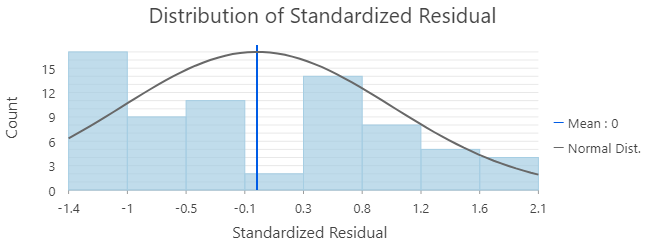
Most notably the regression residuals (e – the random error or difference between the observed value of PPR_2SEHZ and its predicted value)
are not normally distributed and have a non-random pattern.
There are some large values that clearly indicate the weak or poor fit.
However, interpretation of the spatial pattern of the residuals without transforming the data
is potentially useful for understanding the distribution of health care disparities
in New Mexico.
In general, most geographic or spatial data are not independent random samples from a controlled experiment.
They are usually mostly complete or selected enumerations from administratively defined geographic data collection units.
For most population related data there is a tendency for groups of data collection units with similar aspects or measurements to cluster.
This tendency where "near things are more related to distant things" has been refered to as
Tobler's Law (the first law of geography).
The spatial relationship being modeled by this example regression are using data that are not independent but are somewhat dependent.
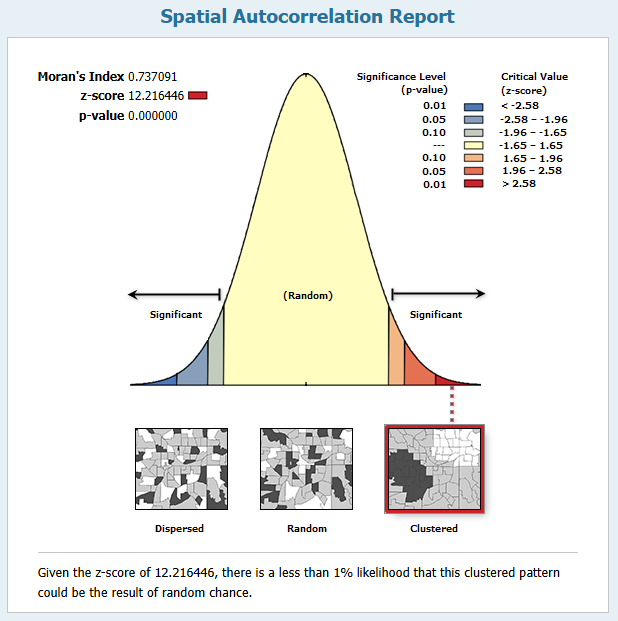
The maps of the standardized residuals
and studentized residualas (see the Web Map below)
captures this characteristic of spatial data and the patterns that are displayed are informative.
The residuals that are displayed in both of the residual maps are spatially clustered
(spatial autocorrelation) wich is an indication
that the model could be improved with the addition of more explanatory variables or perhaps with only an improved
more comprehensive and relevant social and healthcare related index.
The Global Moran's I results from ArcGIS Pro (see below) clearly show how extremely clustered
the standardized residuals are.
Both residual maps display clusters of house districts with potential extreme disparities or overservice.
There are extremly below average areas of potential disparities (< -0.75 Std. Deviations, Dark Blue) in various areas of the state
such as in the vicinity of Reserve, Springer, Roswell, Carlsbad, and Farmington.
There are also above average areas of potential overservice (> 0.75 Std. Deviations, Oranges)
in the north central portions of the state in and near the metropolitian areas of
Albuquerque, Santa Fe, and Los Alamos.
NOTE: Development of a more detailed SDOH index for New Mexico and the availability of official physician data should
improve the results and utility for this type of model in the future.
Also evaluation of routine data transformations should be performed, but the explainability of results should be considered.
View the Web Map in a new tab
Toggle side panel (top left) for Zoom, Layers, and Legend
(Click map feature for pop-up information)
Summary and Conclusions
Being prepared
The main goal of this long-term applied research project has been to show how improved spatial-statistical
methods can be used to provide useful data-driven information
to policymakers about the geographic distribution and potential access to primary care, other
healthcare professionals, and facilities within the state of New Mexico.
This applied research goal requires the results to be presented in an easily explainable and
understandable manner that will aid the decision process.
However, there is a balance between the applied, and academic issues, plus the technical details that
need to be properly addressed.
The various gravity-based models that have been evaluated are the most basic forms with respect
to their geographic components and numerical characteristics.
But the spatial-statistical regression models are more complex. They require more detailed explanations
and careful interpretation of the results.
Note: More work is necessary to refine both the gravity-based and
spatial-statistical regression models and improve the presentation of results.
Subsequent refinements will consider demand-based accessibility measures such as insurance coverage.
A more in-depth summary and conclusion section is being prepared
that will discuss the potential utility of these spatial-statistical models but
also emphasize that they are just simplifications of reality and will never be perfect
(see
"All models are wrong, but some are useful").
In addition, an ArcGIS Story Map is being prepared that will clearly illustrate and explain the
practical utility of these spatial-statistical methods to promote more informed decisions by policymakers
and hopefully better access to healthcare for communities throughout the state.
Additional Note: This work has progressed slowly during the second half of 2024
and will also move slowly during 2025.
It has been a long-term and part-time personal research project conducted during my retirement.
It is not currently a class project nor is it being conducted in cooperation with any UNM department.
However, it is related to the previous work performed with other staff and students of the former
Division of Government Research (DGR) at UNM.
Some of the reasons for this slow progress are due to the additional classes I have and will be taking
from
UNM's College of Population Health.
I need to obtain a reasonable background in public health in addition to my geography and statistics background.
This should help to eventually develop a more realistic test
social determinants of health (SDOH) index hopefully with the collaboration of other researchers.
This test SDOH index can be used to better evaluate the geographic accessibility gravity models.
I am preparing an additional web page
that is focused on developing this updated test SDOH
for New Mexico and demonstrating its utility.
I hope that other researchers will find these results useful both here in New Mexico and elsewhere.
Selected Links and Publications
I recently prepared a literature review and a very brief
power point class presentation
for Geography 601 (Intro to Geographic Theory and Application, Fall 2021).
I will be providing a link to some of the publications and web resources I found useful.
As this is an ongoing research project, I will include some additional more recent items in the future.
Address and Contact Information
     Larry Spear, Sr. Research Scientist (Ret.)
     Division of Government Research
     University of New Mexico

     Email: lspear@unm.edu  lspearnm@gmail.com
     WWW: https://www.unm.edu/~lspear
     LinkedIn https://www.linkedin.com/in/larry-spear-93371970
 UNM's Home Page
Last Revised: 1/6/2025 Larry Spear (lspear@unm.edu)