

|
|
|
|
|
|
|
|||
Detecting Neogene uplift along the Jemez lineament with GIS > Analysis
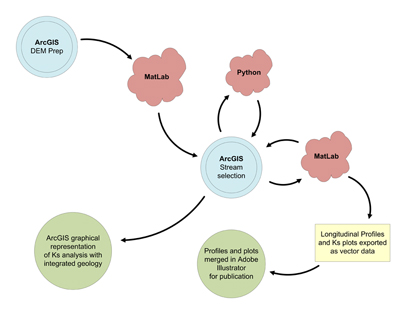
The core component of the analysis is achieved with the Stream Profiler Toolset (SPT) developed by Kelin Whipple et al. SPT consists of a set of scripts written in Python and Matlab that extract longitudinal river profiles, calculate the slope of each point on the river, and calculates basin area feeding each point. This provides a proxy for stream power, if the slope of the river is steeper than a reference slope for the area of basin feeding that point, the stream is cutting faster than average. |
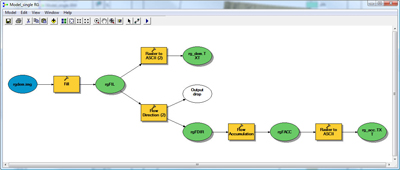
DEMs are mosaiced, filled, flow directioned and accumulated, then exported to ASCII for Matlab to process. The first step for Matlab is converting the ACSII files to Matlab native files. Computing time required for these initial steps on the Rio Grande basin from head waters to Elephant Butte plus the Canadian/Mora basin to the Texas border is roughly three hours. Ensuring all parameters (extent, scratch, etc) are set properly the first time is critical.
|
ArcMap: Most of the analysis for this project is done in Matlab. ArcMap is used to select the headwaters of rivers for analysis, Matlab works from the headwaters down to the mouth. In regions where the slope/area values were anomalously high, I "selected by location" the geology of these reaches of river to determine the bedrock conditions. These initial investigations returned some promising results for more detailed future study. |
Matlab: There are two Matlab components of the analysis. One creates a slope/basin area layer for import into ArcMAP. The second consists of selecting certain reaches of the rivers for slope determination. This portion of the process is still under development to, hopefully, be mastered before AGU in December. My advisor and I are currently working on a systematic way to compare rivers using the second Matlab component. |
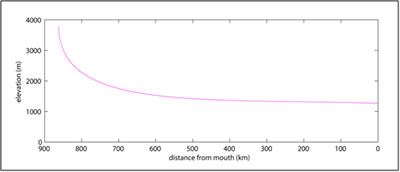
The key GIS analysis is correlation of knick points or convexities, in the longitudinal river profiles with geological bedrock. The slope/area map should match with knick points in the longitudinal profile. Certain areas are known to contain bedrock controls for the well defined convexities. The Rio Grande Gorge near Taos is one of these regions. Thick basalt, lava flows filling the river valley require the Rio Grande to get steeper in order to continue cutting its way up stream. All rivers would like to have a nice smooth concave profile, when a convexity forms in the profile the river works hard to remove it.
|
 |
| Project Home | Next > |
| Analysis | Results | Future Work |