![]() Mapping the History
of Extractive Oil and Gas Industries in Lea County in Light
of the Transition to Unconventional Methods
Mapping the History
of Extractive Oil and Gas Industries in Lea County in Light
of the Transition to Unconventional Methods
Introduction Motivation Methods Results Conclusions Future Work
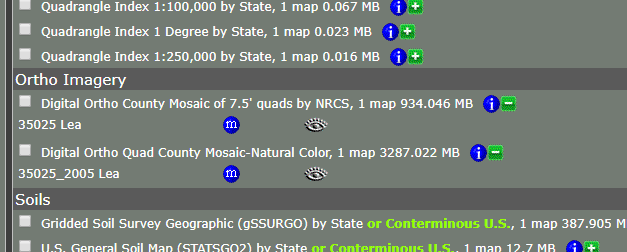
Aerial
imagery is from the National Agriculture Imagery Project (NAIP).
I downloaded
the data from the USDA Natural Resources Conservation Service “Geospatial Data
Gateway”
There is a
plethora of data you can request for free download here, based on an
interactive location and product requests.
You can
download data as a geodatabase or as shapefiles.
I downloaded
the “digital orthophotoquad” in the 7.5 minute mosaic. Which came projected in UTM Zone 13.
Well data is
from New Mexico Oil and Gas Conservation Division website
ftp://164.64.106.6/Public/OCD/OCD%20GIS%20Data/
These were
comprehensive shapefiles using NAD 1983 GCS, but I only needed these
attributes:
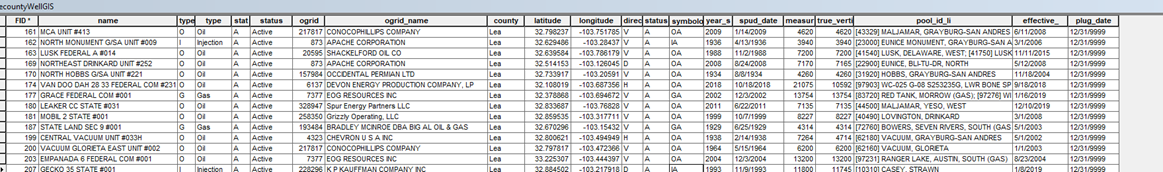
I used select by attribute to group wells on a variety factors. I
used various combination of type, status, direction, year-spud, spud-date,
effective, and plug-date.
I used
‘export data’ and ‘save as layer’ to turn the important selections into other shapefiles, and add them to the map.
Then I
changed the symbology and configuration of the layers upon basemaps
I had made in order to highlight and compare different things.
Back to top Homepage Class Homepage