Mapping the History of Extractive Oil and Gas Industries in Lea
County in Light of the Transition to Unconventional
Methods
![]() Introduction Motivation Methods Results Conclusions Future Work
Introduction Motivation Methods Results Conclusions Future Work
Although the
data available readily supports a broad analysis of the history of oil well
activity in the county. It would take a bit more work to a more thorough and
complete analysis, plugging any gaps in the data, and providing insight into
regional trends. NM Oil and Gas Conservation Division maintains robust and fairly well-organized databases of well activity through its
role as regulator of the industry. NM OCD’s website mentions that they are
undertaking the task of digitizing all of their
public-facing data to GIS formats, and it’s obvious they have made good
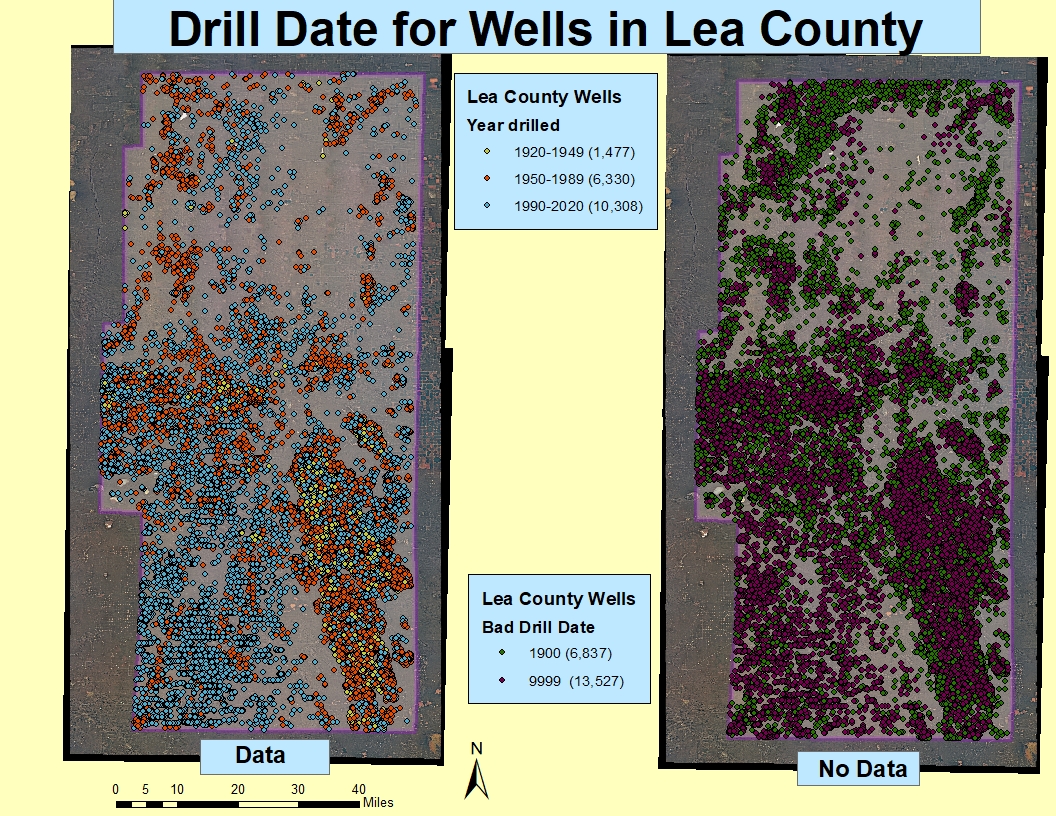
progress, but there some large gaps still at this point. Data about old wells
can be hard to figure out. There is a massive amount
of wells that have “1/1/1900” listed as their inception date. This indicates a
well that was drilled before current regulation structures existed. They were
drilled “pre ONGARD,” as OCD says. ONGARD is the “Oil and Natural Gas
Administration and Revenue Database, ” and tracks
wells with an “API,” an American Petroleum Institute unique identifier. Prior
to ONGARD well data was collected into annual reports by OCD, and it has been
hard to reconcile the two databases. This causes the GIS data from OCD to be
woefully incomplete at places. When trying to get an accurate history of well
activity, you will come across a number of wells that have a “spud” (or drill)
date of 1990 or 9999, but then you will have an “effective” date of 1997, 2003,
2014, and a status of active listed. The effective field is a record of the last
official action that was documented by OCD in relation to the well. When you
access the individual well files located on OCD’s website by hyperlink from the
metadata or the attribute table, you may be able to get a pretty good idea of
when the will was drilled by the record of production data stored with each
individual well’s files. But look at this next chart. There is
more than 20,000 wells with inaccurate drill date data at this point.
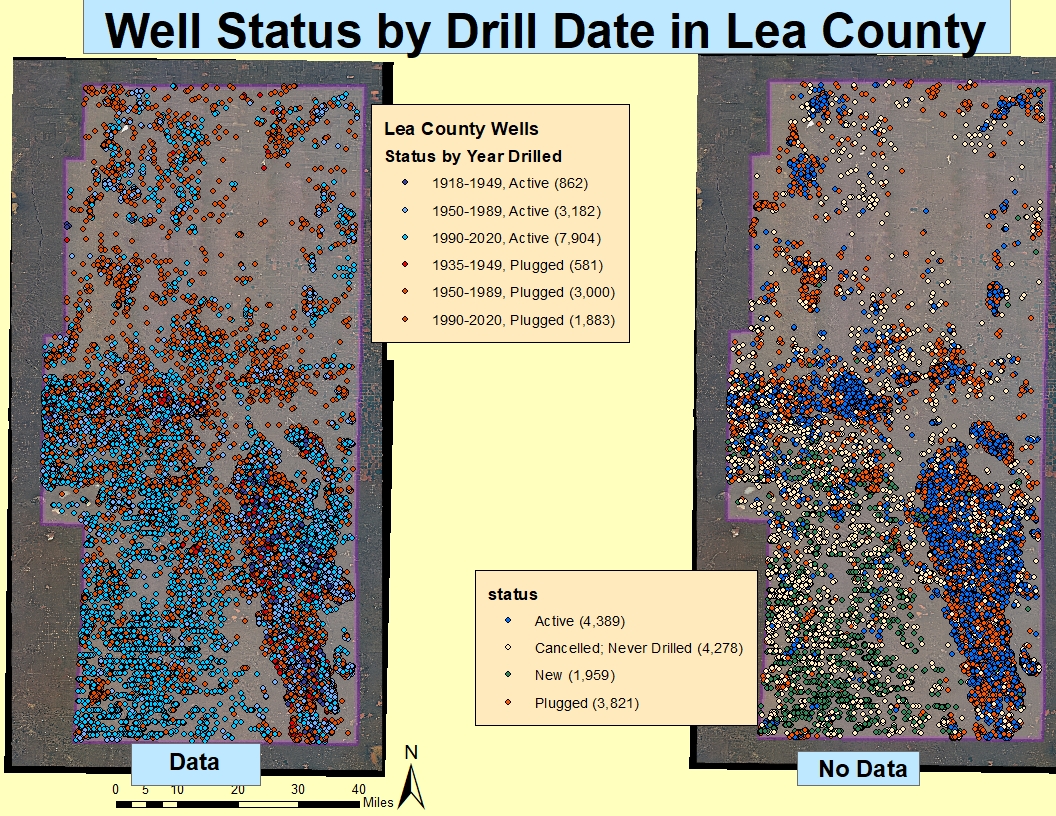
This next
chart shows the same information by year and status for wells with known drill
dates, and by status for wells with no spud data provided.
The other
future work I would like to propose is the integration of this work with other
aspects of the industry’s infrastructure like pipelines, compressor stations,
and storage tanks.
Then of
course there is always the environmental data, such as methane emissions from
venting, flaring, and leakages to look at as well socioeconomic effects.
Finally, one
thing I think would be really interesting would be to do an in-depth study of
old wells that are re-drilled, or re-established by
new companies now that they can use fracking technology to try and make them
productive.
Thank to
everyone for checking out my project!