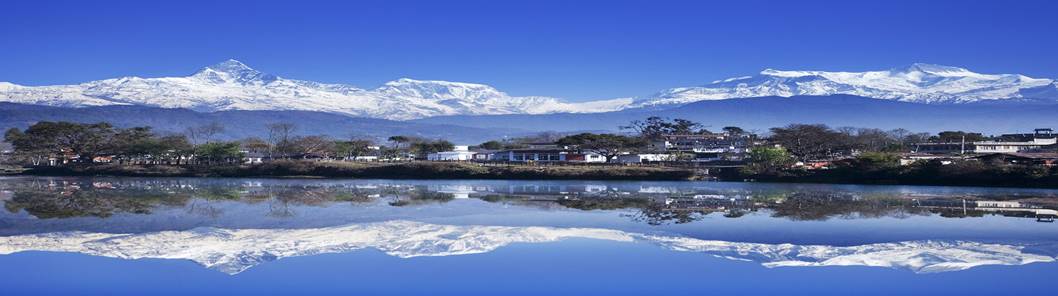
Study of
Nutrients (Nitrogen and Phosphorous) in Phewa Lake Sediments
Result and Discussion
Samples were collected for 16 locations which is shown in figure 1 below
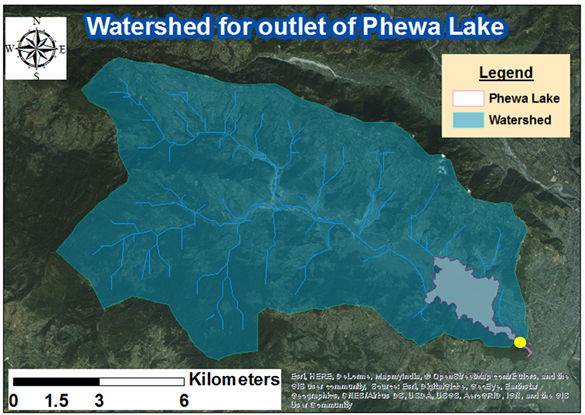
for analysis of concentration of nutrients. The watershed of lake occupies the
area of about 112 Km2 for the outlet of lake (outlet shown by yellow
dot in figure 2) and watershed is shown in figure 2.
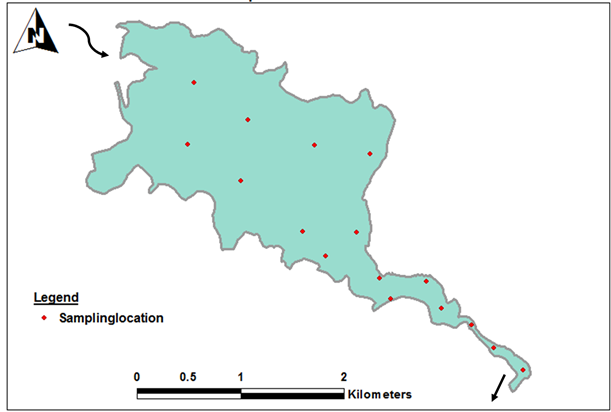
Figure
1: Sample location Figure
2: Watershed for outlet of Phewa lake
Kriging
method is used for showing the distribution map for concentration of Nitrogen
and Phosphorous
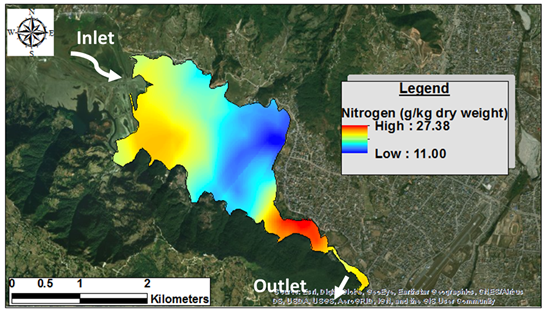
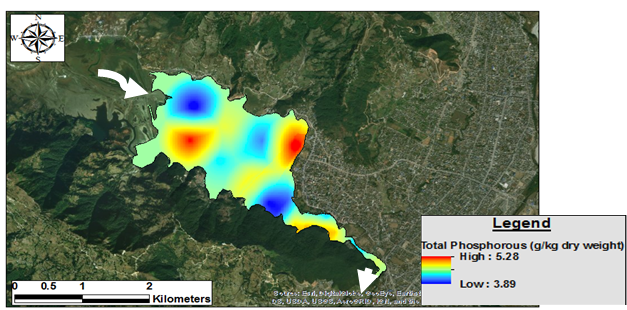
Figure
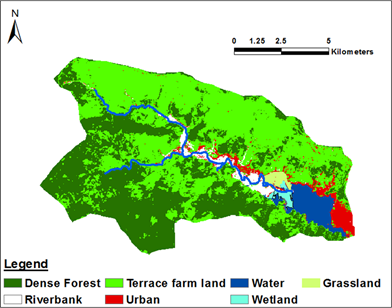
3: Nitrogen distribution Figure 4:
Phosphorus distribution Figure 5: Land use map
From above figure it is seen
that, nitrogen is higher at inlet and outlet of lake. Since inlet accumulate
the water from agricultural land and outlet receives water draining from urban
area without proper treatment, the distribution of nitrogen looks fine on the basis of landuse.
Similarly, phosphorus is extreme at inlet receiving water from dense forest and
agricultural farm. Also, since northeast corner of lake receive drained water
from urban and erosion from dense forest, has high concentration of
phosphorous.
![]() My homepage
My homepage
![]() Class homepage
Class homepage
![]() GIS in water resource,
Class Work
GIS in water resource,
Class Work